Check that every column is what its dictionary says before computing a single summary: types, ranges, distinct values, missing values and their stand-ins, duplicated rows. Write the checks as one audit function and as assertions, and keep a log of every fix.
Run the five checks of an audit (type, range, distinct values, missing values and stand-ins, duplicated rows) and say what each one can catch.
Write an audit as one function that returns a table, and as assertions that stop the analysis when a check fails.
Keep a cleaning log that records every change, the rows it touched and the reason.
Explain why a published table with no missing values is itself a finding about how the data were prepared.
In review. The maths and code on this page are checked by automated tests on every change, but an independent reader has not signed it off yet. Spot a mistake or a confusing step? Tell us.
The question
The diabetes table has 442 rows, eleven columns, no missing values and no duplicated rows. Is that good news? And how would you know if a rent had been typed in euros instead of hundreds of euros, before it had quietly multiplied your mean by almost ten?
From the last lesson
1. Name one group of people the diabetes table cannot speak for, and say why.
Show answer
People without diabetes (none are in it), or patients who were not scored a year later (every row needs that score, so they cannot be rows).
2. What does load_diabetes() do to each column by default?
Show answer
It subtracts the column’s mean and divides by its standard deviation (divisor \(n\)) times \({\sqrt{n}}\). Every value becomes a z-score divided by 21, and the units are gone.
Intuition
A summary is only as good as the column under it. A mean of rents that hides one value in euros is wrong by a factor that no later step can see. So before step 4 of the workflow, step 3 asks a plain question of every column: is it what the dictionary says it is?
An audit answers that question with a fixed list of checks. Each check has an expected answer written in the dictionary, and a flag is any place where the table disagrees. The audit does not fix anything. It returns a table of what it found.
S01.8.2-F1
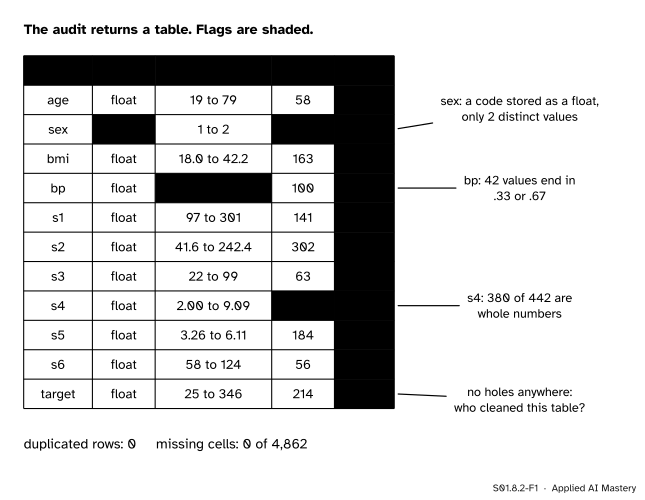
The audit of the diabetes table, as the audit function returns it. Three columns raise a flag, and so does the missing column as a whole: a medical table with no holes at all is unusual.
Three things in the picture are worth a second look. sex is a code stored as a decimal number. s4 has far fewer distinct values than a measured ratio should. And the column of zeros on the right is not reassuring: it raises the question of who removed the holes, and how.
Build it up
The five checks, one at a time, each with what it finds in the diabetes table.
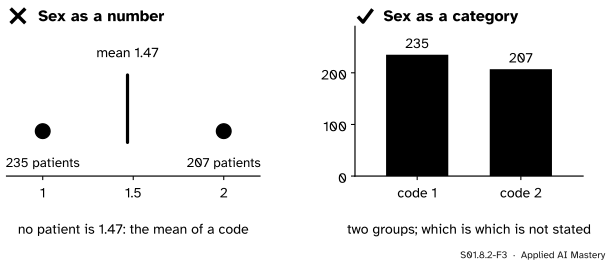
Check 1. Type. Every column is stored as float64, a decimal number. For nine of them that fits. For sex it does not: a nominal label stored as a number invites a mean (1.47) that means nothing. The dictionary of S01.8.1 already said “nominal”, so the audit flags the mismatch.
Check 2. Range. Compare each column’s smallest and largest value with what the dictionary allows. Ages run from 19 to 79 and body mass index from 18.0 to 42.2: both possible for adults. No column holds a zero, a negative number or a value such as −999 that would stand in for “unknown” (S01.6.1). One oddity: 42 of the blood pressures are not whole numbers, and every one of them ends in .33 or .67, in thirds. That is what an average of three whole readings would give. It is a guess, and the audit records it as a question for the data’s owners, not as a fact.
Check 3. Distinct values. Count the different values in each column. sex has 2, as a code should. s4, total cholesterol over HDL, has 66, and most of its values are whole numbers.
S01.8.2-F4
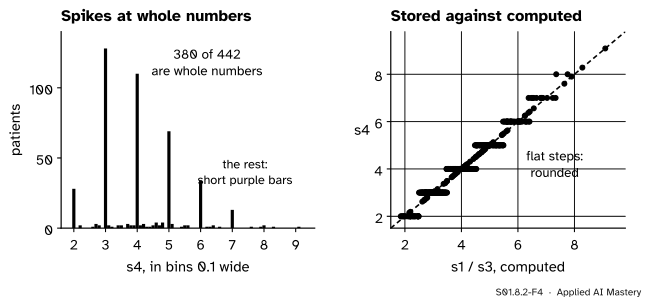
s4 is s1 / s3, mostly rounded to a whole number. Left: 380 of the 442 values are whole numbers. Right: those values form flat steps beside the diagonal; the others sit on it.
Dividing s1 by s3 for every patient settles it. Of the 380 whole values, 370 are s1 / s3 rounded to the nearest whole number; of the other 62, 57 are s1 / s3 to two decimals. So s4 is not a new measurement: it is two other columns, divided and (mostly) rounded. A model that is given all three is told the same thing twice, once blurred.
Check 4. Missing values and their stand-ins. Count NaN in every column, and look for the disguised holes of S01.6.1 (zeros, −999, “unknown”). There are none of either: 0 of the 4,862 cells.
Check 5. Duplicated rows. Two rows that agree in every column are either two identical patients, which is very unlikely with eleven measurements, or one patient entered twice. Here DataFrame.duplicated finds none.
The formal statement
NoteDefinitions: audit, assertion, cleaning log
A check takes one column (or the whole table) and returns a value to compare with the dictionary: a type, a smallest and largest value, a count of distinct values, a count of missing values, a count of duplicated rows. An audit runs every check on every column and returns the results as one table, one row per column.
An assertion is a check written as a statement that must be true, such as assert table["sex"].isin([1, 2]).all(). If it is false, the program stops with an error, so a broken file cannot slip into the analysis unnoticed.
A cleaning log records every change made to the data: which rows, what was changed, from what to what, and why. The analysis is then the raw table plus the log, and anyone can check both.
What a table with no holes says. Lesson S01.6.3 derived the share of complete rows when each of \(k\) columns loses a share \(p\) of its cells, independently of the others. A row survives only if all \(k\) of its cells survive, each with chance \({1 - p}\), so
\[
\text{share of rows kept} = (1 - p)^k .
\]
The diabetes table has \({k = 11}\) columns.
S01.8.2-F5
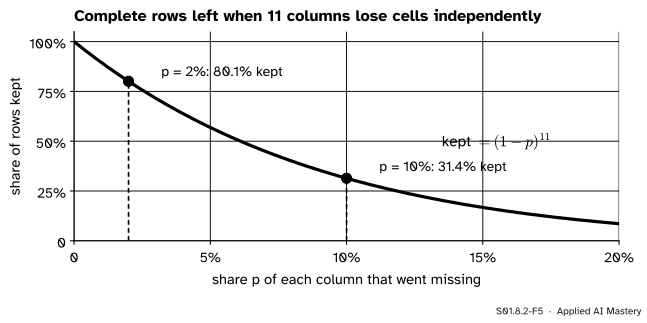
If incomplete rows are dropped, the complete ones that are left fall fast as holes spread across eleven columns. A clean table can be the survivors of a larger one.
At \({p = 0.02}\), two cells in a hundred, \({0.98^{11} = 0.801}\): one row in five is lost. At \({p = 0.10}\), \({0.9^{11} = 0.314}\): two rows in three are lost. Medical data seldom arrive with no holes, so a table with none was either unusually complete or cleaned before it was published, perhaps by dropping rows. The documentation does not say which. If rows were dropped, the 442 are a selection (S01.2.4), and they are a fair sample of the patients only if the holes fell completely at random (S01.6.2). The audit cannot settle this; the report must carry it.
Worked example
Audit the flats table with five planted faults. The course’s nine flats (invented, S01) have been typed into a new file, badly. The file has ten rows.
S01.8.2-F2
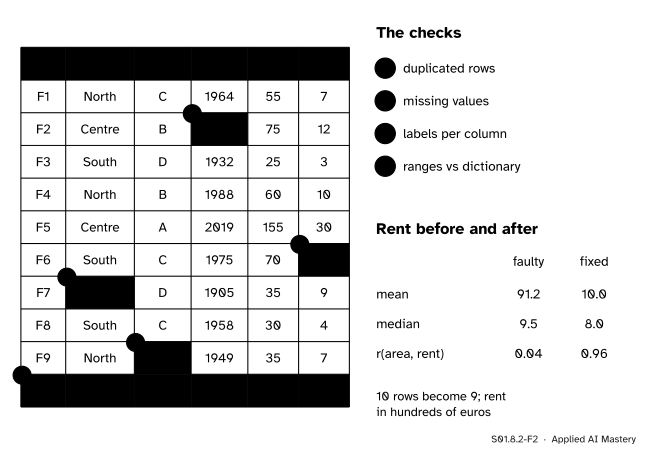
Four checks, five faults. The table on the left is what the file holds; the numbers on the right are the rent summaries before and after the cleaning log below.
Run the checks in order, by hand.
Duplicated rows. The tenth row agrees with F5, the penthouse, in every column: the listing was entered twice. Drop the second copy. Ten rows become nine.
Missing values. F9’s rating is an empty string. That is a hole in disguise: value_counts would report a fifth rating called ““. Record it as missing (NaN), and keep the row, since its rent and area are sound.
Labels per column. The district column has four labels: Centre, Center, North and South. The dictionary allows three. “Center” is “Centre” in American spelling: recode it.
Ranges against the dictionary. F2 was built in 2096, which has not happened yet; the agency’s listing says 1996. F6’s rent is 800, but the dictionary says rent is in hundreds of euros, so 800 would be 80,000 euros a month. It is 800 euros typed in euros: divide by 100 to get 8.
The cleaning log records each change:
Change
Reason
drop the 2nd F5
duplicate
F9 rating: blank to NaN
blank string
F7: Center to Centre
not in dictionary
F2 built: 2096 to 1996
in the future
F6 rent: 800 to 8
above 100
Now the rents. Before the log, the ten rents add up to 912, so the mean is \({912 / 10 = 91.2}\). Sorted, they are 3, 4, 7, 7, 9, 10, 12, 30, 30, 800, and the median is the average of the 5th and 6th, \({(9 + 10)/2 = 9.5}\). After the log the rents are the course’s nine, with mean 10 and median 8. The correlation of area with rent moves from 0.04 to 0.96. One unit typed wrong turned the course’s strongest relationship into nothing.
Notice what the audit did not do: it left the penthouse alone. A rent of 30 is unusual but possible, and judging it is the outlier work of S01.4.4, not the audit’s. The audit compares the table with its dictionary, never with what the analyst hoped to see.
Code
First the audit from scratch: one loop over the columns, one dictionary per column, gathered into a table.
The audit’s findings become assertions, so that a new copy of the file that breaks them stops the analysis. Then the two flags are followed up: s4 against s1 / s3, and the thirds in bp.
assert table.notna().all().all(), "a cell is missing"assertnot table.duplicated().any(), "a row is duplicated"assert table["sex"].isin([1, 2]).all(), "sex is not coded 1 or 2"assert table["age"].between(18, 100).all(), "an age is out of range"ratio = table["s1"] / table["s3"]whole = table["s4"] == table["s4"].round()print("whole s4 equal to s1/s3 rounded:", int((table["s4"][whole] == ratio[whole].round()).sum()), "of", int(whole.sum()))print("other s4 equal to s1/s3 to 2 decimals:",int(np.isclose(table["s4"][~whole], ratio[~whole].round(2)).sum()), "of", int((~whole).sum()))fraction = (table["bp"] - np.floor(table["bp"])).round(2)print("bp fractions:", fraction[fraction >0].value_counts().to_dict())
whole s4 equal to s1/s3 rounded: 370 of 380
other s4 equal to s1/s3 to 2 decimals: 57 of 62
bp fractions: {0.33: 24, 0.67: 18}
Now the worked example: the faulty flats, cleaned step by step with a log.
before: (91.2, 9.5, 0.04)
after:  (10.0, 8.0, 0.96)
                 step  rows                       reason
0  drop the second F5     9         same in every column
1    F9 rating to NaN     9                 blank string
2    Center to Centre     9  label not in the dictionary
3    fix 2096 and 800     9    outside the allowed range
The library has the checks ready-made: DataFrame.info() gives types and non-missing counts, describe() the ranges, nunique() the distinct values and duplicated() the repeated rows. The loop above is what they compute; the log is what no library writes for you.
Explore
S01.8-X1
Audit trail
Press the checks one at a time and watch which cells each one lights up. Then fix or ignore each fault it found, in any order, and see which faults move the mean, the median and the correlation, and which only move the district labels, the ratings or the newest year built.
Pitfalls
S01.8.2-F3
Wrong beside right. A code stored as a number invites a mean. Counted as a category, it gives two groups, and the open question about which is which stays visible.
“No missing values: the data are complete.”
They may be the complete survivors. A published table with no holes was often cleaned, and dropping incomplete rows is the default way of handling holes in many statistical packages (van Buuren, Section 1.3.1). Say in the report that you cannot tell, and what it would mean if rows were dropped.
“I fixed it, so there is nothing to report.”
A silent fix makes the analysis impossible to check. Every change goes in the log with its reason, and the log goes with the results. If a fix is wrong, the log is how someone finds it.
“The audit should remove the odd values.”
The audit compares the table with its dictionary. A rent of 800 breaks the dictionary; a rent of 30 does not, however far it sits from the others. Judging unusual but possible values is the outlier step (S01.4.4), and it never deletes them silently.
Check yourself
Recall
1. Name the five checks of the audit.
Show answer
Type, range against the dictionary, number of distinct values, missing values and their stand-ins, and duplicated rows.
2. What is the difference between an audit and an assertion?
Show answer
An audit reports what it finds as a table and changes nothing. An assertion states what must be true and stops the program when it is not.
3. What does s4 turn out to be, and how did the audit find out?
Show answer
s1 / s3, rounded to a whole number for most patients. The distinct-value check showed that 380 of 442 values are whole numbers, and dividing s1 by s3 matched them.
4. Why is a table with no missing values a finding to report?
Show answer
Real medical data usually have holes, so the table was probably cleaned, perhaps by dropping incomplete rows. If so, the rows are a selection, fair only if the holes fell completely at random.
5. What goes in a cleaning log?
Show answer
Every change: the rows it touched, what was changed from and to, and the reason.
Exercises
1.★ In the faulty flats table, fix only the rent of 800 (to 8) and leave the other four faults. Find the mean and the median rent of the ten rows.
Show solution
The ten rents are 7, 12, 3, 10, 30, 8, 9, 4, 7 and 30, which add up to 120, so the mean is \({120 / 10 = 12.0}\). Sorted: 3, 4, 7, 7, 8, 9, 10, 12, 30, 30. The median is the average of the 5th and 6th values, \({(8 + 9)/2 = 8.5}\). The duplicated penthouse still pulls the mean up by 2.
2.★★ Drop the duplicated row but leave “Center” as it is. What is the mean rent of the flats labelled Centre? What is it after the recoding? Why does the spelling fault move this mean but not the mean of all nine rents?
Show solution
Labelled Centre are F2 (12) and F5 (30): mean \({42 / 2 = 21}\). After the recoding F7 (9) joins them: \({51 / 3 = 17}\). The overall mean uses every rent whatever its label, so a label fault leaves it alone; a group mean depends on which rows carry the label, so the fault moves it by 4.
3.★★★ Suppose the diabetes study first had \(N\) rows, each of its 11 columns lost a share \(p\) of its cells independently, and every incomplete row was dropped, leaving 442. (a) If \({p = 0.02}\), estimate \(N\). (b) Which \(p\) would mean that exactly half the rows were dropped?
Show solution
(a) The expected share kept is \({0.98^{11} = 0.801}\), so \({N \approx 442 / 0.801 = 552}\): about 110 patients would have been dropped.
(b) Half kept means \({(1 - p)^{11} = 0.5}\). Take the 11th root of both sides: \({1 - p = 0.5^{1/11} = 0.9389}\), so \({p = 0.061}\). Six cells in a hundred, spread over eleven columns, are enough to lose half the rows.
Summary card
Check every column against its dictionary before trusting any summary, and log every fix.
S01.8.2-F1
The audit returns a table.
Five checks. Type, range, distinct values, missing values and stand-ins, duplicated rows.
Assertions turn the checks into rules that stop a broken file.
Cleaning log. Rows, change, reason: the raw table plus the log is the analysis.
No holes is a finding. Complete rows kept: \({(1 - p)^k}\).
Sources and next steps
Sources. Each was opened and checked against this lesson on 12 November 2026.
Allen Downey, Think Stats, third edition, chapter 1, Section 1.4, Validation: checking counts with value_counts against the codebook, and replacing the special codes 97, 98 and 99 for an unknown birth weight with NaN.
pandas, DataFrame.duplicated: a row is a duplicate when the same values appear again across the chosen columns, and by default every copy after the first is marked.