An analysis starts before the first mean: with a question, with where the data came from, and with a dictionary that gives every column a meaning, a unit and a scale. Meet the seven-step workflow and the capstone table of 442 diabetes patients.
Name the seven steps of an exploratory analysis in order and say why the question comes first.
Describe what one row of a table is, where the data came from, and who is and is not in the sample.
Write a data dictionary that gives every column a meaning, a unit, a scale and its open questions.
Recognise a column that has been centred and rescaled, and show why its original units cannot be read back from it.
In review. The maths and code on this page are checked by automated tests on every change, but an independent reader has not signed it off yet. Spot a mistake or a confusing step? Tell us.
The question
A colleague hands you a table: 442 rows, eleven columns, and numbers such as 0.038 and −0.045. You could compute a hundred summaries in a minute. Which ones, in what order, and what do you need to know before the first of them means anything?
Intuition
The modules of this course each gave you one tool: a scale for every column, a way to judge a sample, a centre and a spread, a picture of a distribution, a correlation, a plan for holes, and a warning about subgroups. An analysis workflow is the order in which to use them, so that each step rests on the ones before it.
S01.8.1-F1
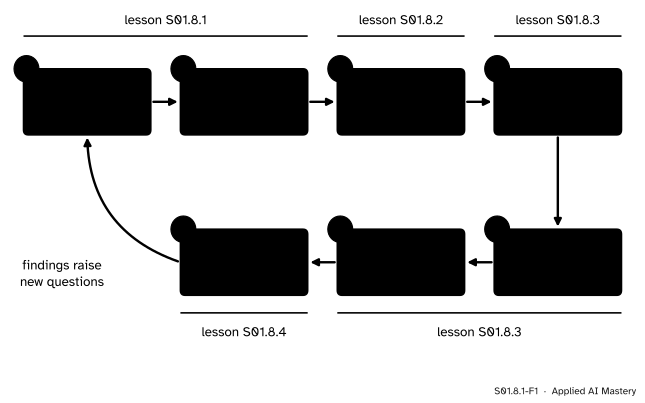
The workflow of this module. The first three steps (blue) come before any summary is trusted; the next three (vermillion) compute summaries; the last (green) reports them. A report usually raises new questions, and the loop starts again.
Read the picture as a set of promises. You will not summarise a column before you know what it measures (steps 1 and 2) and that it holds what it claims (step 3). You will not compare two columns before you have looked at each alone (step 4 before step 5). You will not report a relationship before you have checked that it survives a split into groups (step 6). And the report says what you did not find and cannot claim, as well as what you did (step 7).
The question comes first because a table has no single “right” summary. With 11 columns there are 55 pairs to correlate, dozens of subgroups to split by and many ways to clean. A question picks the few summaries that matter, and it fixes them before the numbers are seen. That matters for honesty: lesson S01.8.4 counts how much was looked at.
Build it up
This lesson takes the first two steps on the module’s real table, and starts its dictionary.
Step 1. The question. The table comes from a study of 442 people with diabetes. In the paper that published it, the statisticians Efron, Hastie, Johnstone and Tibshirani write that they were asked for a model that predicts the response from the ten measurements, with two hopes: accurate predictions for future patients, and a model whose form “would suggest which covariates were important factors in disease progression”. Prediction is the job of ML01.10. Our question is the exploratory one that comes before it:
Which of the ten measurements taken at a first visit go together with a larger progression score a year later, how strongly, and does the answer hold for every group of patients?
The question fixes three things at once. The unit is a patient. The outcome is the score a year on. And the comparisons that matter are each measurement against the score, then inside groups: about a dozen summaries, not a hundred.
Step 2. Provenance: where the data came from. Provenance is the history of a table: who measured what, when, and what was done to it before it reached you. Here the trail has four links.
The study measured the patients. Its paper (Efron and others, 2004, Table 1) prints the first six rows and the last two.
Dennis Boos at North Carolina State University posts the raw file and a standardised copy.
scikit-learn ships both inside the library, as load_diabetes.
You load it. The default call returns the standardised copy.
Each link can change the data. The paper prints s5 to one decimal (4.9 for patient 1), while the library holds four (4.8598). The fourth link changes every value, which the formal statement below takes apart.
Step 3. What one row is. One row is one patient: ten numbers from a first visit (the baseline) and one number, the progression score, from a year later. In the language of ML01.1.2 a row is an example, the ten measurements are its features and the score is its target.
Step 4. Who is in the sample, and who is not. Lesson S01.2.1 asked for the target population, the sampling frame and the sample. The documentation gives the sample (442 patients) and almost nothing else.
S01.8.1-F4
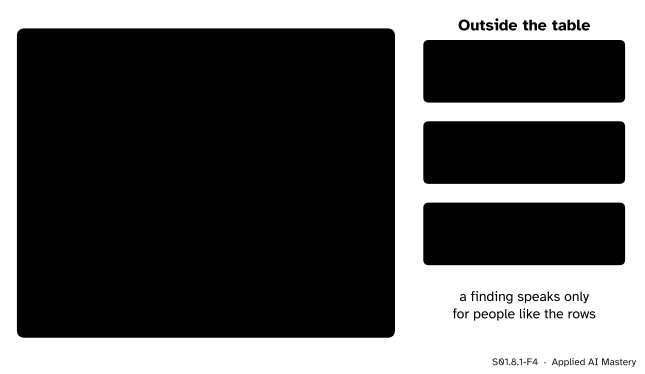
Who the 442 rows can speak for. Every row has a score a year on, so anyone who was not scored again cannot be in the table. How the patients were chosen is not stated.
Two things follow without any documentation. Everyone in the table has diabetes, so nothing in it compares people with and without the disease. And everyone was scored again a year later, so a patient who left the study before then is missing by construction: the survivorship of S01.2.4. A finding from these rows speaks for patients like them, and the report must say so.
The formal statement
NoteDefinition: data dictionary
A data dictionary gives, for every column of a table, its name, what it measures, its unit, its scale (nominal, ordinal, interval or ratio, from S01.1) and its allowed values. A column whose documentation leaves any of these open gets an open question, to be settled by the audit of S01.8.2 or carried into the report.
The documentation of load_diabetes names the ten columns: age in years, sex, body mass index, average blood pressure, and six blood serum measurements s1 to s6 (total cholesterol, LDL, HDL, total cholesterol over HDL, “possibly log of serum triglycerides level”, and blood sugar). It gives no other units, no key for sex, and no unit for the score.
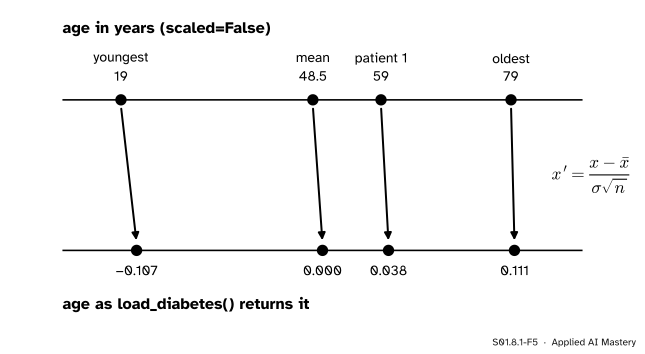
The trap in the default loader. Called with no arguments, load_diabetes() does not return these measurements. It returns each column centred on its mean and divided by its standard deviation times \({\sqrt{n}}\). Write \(\bar{x}\) for the column’s mean and \(\sigma\) for its standard deviation with divisor \(n\): the documentation does not name the divisor, but this is the one that makes the squares sum to 1, as it promises (below), and it matches the stored values. Each value becomes
That is the “sum of squares of each column totals 1” of the documentation. It is also why the values are so small: 442 squares share a total of 1.
It is a shrunken z-score. The z-score of S01.3.4 divides by \(s\), with divisor \(n - 1\), so \({s^2 = n\sigma^2 / (n - 1)}\). Then \({\sigma\sqrt{n} = s\sqrt{n-1}}\), and
With \({n = 442}\), \({\sqrt{441} = 21}\): every value of the default table is a z-score divided by 21.
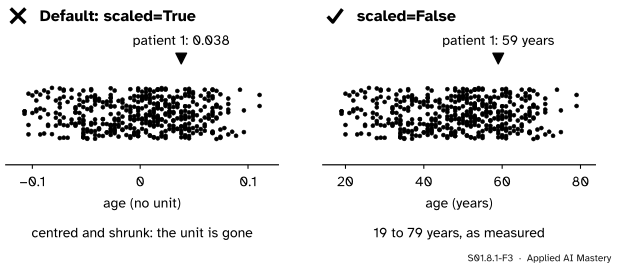
Its units cannot be read back. Undoing the map needs \({x_i = \bar{x} + \sigma\sqrt{n}\,x_i'}\), and the scaled table stores neither \(\bar{x}\) nor \(\sigma\). The value 0.038 does not say whether patient 1 is 59 years old or 59 kilograms.
Worked example
Read the first patient’s row through the dictionary. With scaled=False the first row is age 59, sex 2, body mass index 32.1, blood pressure 101, then s1 to s6 equal to 157, 93.2, 38, 4, 4.8598 and 87, and a score of 151.
S01.8.1-F2
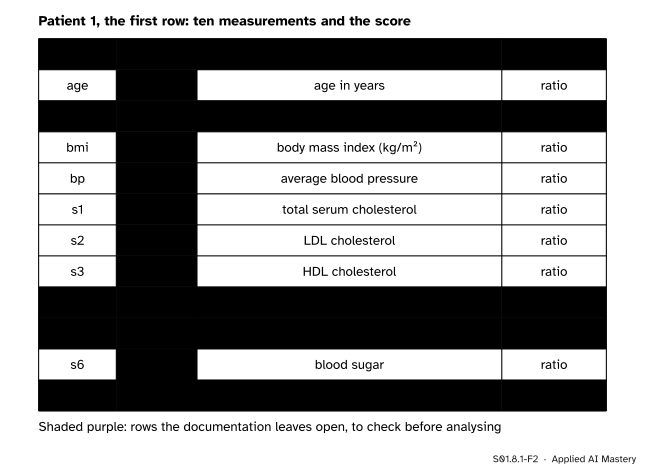
The first row read column by column. Four rows (purple) leave an open question that the audit or the report must carry.
Go down the rows and ask the dictionary’s questions of each.
age is 59 years: a ratio scale, since 0 years means no age and 60 is twice 30.
sex is 2. The number is a code, a label stored as a digit (S01.1.2). There are 235 patients coded 1 and 207 coded 2, and nothing says which is which. Its scale is nominal, so its mean, 1.47, means nothing.
bmi is body mass index, which is defined as mass in kilograms over height in metres squared: 32.1 is a ratio-scale value in kg/m².
s4 should be \({s1 / s3 = 157 / 38 = 4.13}\), yet the table stores 4. Is the column rounded? That is an open question for the audit.
s5 is “possibly” a logarithm. If it is, a difference of 1 in s5 multiplies the triglycerides by \({e \approx 2.72}\) (M01.4), so equal steps are equal ratios and the zero is not a true zero: an interval scale. Write the doubt down.
target is 151 on a scale the documentation calls “a quantitative measure of disease progression”. No unit, no range of possible values: another open question.
Four of eleven columns already carry an open question, and not one summary has been computed.
Code
First the table, loaded in its own units, and the dictionary written by hand as a list of dictionaries, one per column.
from sklearn.datasets import load_diabetestable = load_diabetes(as_frame=True, scaled=False).frameprint(table.shape)print(table.iloc[0].to_dict())dictionary = [ {"column": "age", "meaning": "age", "unit": "years", "scale": "ratio", "open": ""}, {"column": "sex", "meaning": "sex", "unit": "", "scale": "nominal", "open": "which code is which?"}, {"column": "bmi", "meaning": "body mass index", "unit": "kg/m2", "scale": "ratio", "open": ""}, {"column": "s4", "meaning": "total cholesterol / HDL", "unit": "", "scale": "ratio", "open": "rounded?"}, {"column": "s5", "meaning": "triglycerides, possibly log", "unit": "", "scale": "interval", "open": "a log?"}, {"column": "target", "meaning": "progression a year on", "unit": "", "scale": "?", "open": "unit, range"},] # the other five columns follow the same patternopen_questions = [d["column"] for d in dictionary if d["open"]]print("open questions:", open_questions)print("s1 / s3 for patient 1:", round(table.s1[0] / table.s3[0], 2), " stored s4:", table.s4[0])
Now the default loader, and the three facts of the formal statement checked on its age column.
import numpy as npscaled = load_diabetes(as_frame=True).frameage, age_scaled = table["age"].to_numpy(), scaled["age"].to_numpy()n =len(age)mine = (age - age.mean()) / (age.std() * np.sqrt(n)) # numpy's std divides by n by defaultz = (age - age.mean()) / age.std(ddof=1) # the z-score of S01.3.4print("patient 1:", round(age_scaled[0], 4), " by hand:", round(mine[0], 4))print("sum:", round(abs(age_scaled.sum()), 10), " sum of squares:", round((age_scaled **2).sum(), 10))print("z / 21 for patient 1:", round(z[0] /21, 4))print("range:", round(age_scaled.min(), 3), "to", round(age_scaled.max(), 3))
patient 1: 0.0381  by hand: 0.0381
sum: 0.0  sum of squares: 1.0
z / 21 for patient 1: 0.0381
range: -0.107 to 0.111
The library computes the same map. The fix is one argument, scaled=False, and the habit of reading a loader’s documentation before trusting its numbers.
Explore
This module’s interactive, the audit trail, lives in the next lesson, where the workflow’s checks are run on a table with planted faults.
Pitfalls
S01.8.1-F3
Wrong beside right. The same 442 ages, loaded two ways. The shape is identical; only the right panel can say how old anyone is.
“I will look at the data first and see what question it answers.”
With enough columns some pattern always turns up, and a question chosen after seeing it makes that pattern look planned. Write the question down first. It may change as you learn, and the report then says that it changed and why.
“load_diabetes() gives me the data.”
It gives a rescaled copy. Means of zero and values near 0.04 are a sign of rescaling, not of the patients. Many machine-learning examples use the scaled copy, which is fine for fitting a model and useless for saying that body mass index runs from 18 to 42.2.
“Sex is 1 or 2, so its mean, 1.47, tells me something.”
A code is a label in disguise. Its mean is as meaningless as a mean district. Count it (235 and 207) and keep the open question: which code is which?
Check yourself
Recall
1. Name the seven steps of the workflow in order.
Show answer
Question, provenance, audit, one column at a time, pairs of columns, traps (subgroups), report.
2. Why does the question come before the first summary?
Show answer
A table allows hundreds of summaries. The question picks the few that matter and fixes them before the numbers are seen, so that a pattern found by looking is not passed off as one that was sought.
3. What is one row of the diabetes table?
Show answer
One patient: ten measurements from a first visit (the baseline) and a progression score from a year later.
4. Name one group of people the table cannot speak for, and say why.
Show answer
People without diabetes (none are in it), or patients who were not scored a year later (every row needs that score, so they cannot be rows).
5. What does load_diabetes() do to each column by default?
Show answer
It subtracts the column’s mean and divides by its standard deviation (divisor \(n\)) times \({\sqrt{n}}\), so that the values sum to 0 and their squares sum to 1.
Exercises
1.★ Patient 2 has s1 = 183, s3 = 70 and a stored s4 of 3. Compute \({s1 / s3}\). Is the stored value that ratio rounded to the nearest whole number?
Show solution
\({183 / 70 = 2.614}\), which rounds to 3. So yes: like patient 1, whose 4.13 was stored as 4, the stored value is the ratio rounded to a whole number. Two rows are a hint, not a proof; the audit of lesson S01.8.2 checks all 442.
2.★★ The oldest patient is 79. The ages have mean 48.518 and standard deviation \({s = 13.109}\) (divisor \({n - 1}\)). Find the oldest patient’s z-score and the value the default loader stores for them.
The loader stores \({z / \sqrt{n - 1} = 2.325 / 21 = 0.111}\), the right-hand point of the bottom line in the formal statement’s figure.
3.★★★ You only have the scaled table, but you are told that the youngest patient is 19 and the oldest 79. Their scaled ages are −0.10723 and 0.11073. Recover the mean age and the factor \(\sigma\sqrt{n}\).
Show solution
Write \(k\) for \(\sigma\sqrt{n}\). Undoing the map gives \({x = \bar{x} + k\,x'}\) for every patient, so the two patients give two equations:
Two known values pin down the whole map, because it is a straight line (M01.3). Without them, nothing can.
Summary card
Question first, then where the data came from, then what each column claims to be.
S01.8.1-F1
Seven steps, one loop.
Unit, outcome, population. The question fixes all three before any number is seen.
Provenance. Every link from the study to your screen can change the data.
Dictionary. Meaning, unit, scale and allowed values for every column; open questions written down.
The default loader.\({x' = (x - \bar{x}) / (\sigma\sqrt{n})}\), which is \({z / \sqrt{n - 1}}\): centred, squares summing to 1, units gone. Use scaled=False.
Sources and next steps
Sources. Each was opened and checked against this lesson on 12 November 2026.
Bradley Efron, Trevor Hastie, Iain Johnstone and Robert Tibshirani, Least Angle Regression, Annals of Statistics 32 (2004), 407 to 499 (the authors’ copy). Section 1 and Table 1: the 442 patients, the ten baseline variables, the response a year after baseline, the first six rows and the last two, and the two hopes of the study quoted in step 1.
scikit-learn 1.9, load_diabetes and user guide Section 9.1.2, Diabetes dataset: the scaled argument (default True, added in version 1.1), the scaling by the standard deviation times the square root of n_samples, and the descriptions of the ten columns quoted here.
Dennis Boos, Diabetes data, North Carolina State University: the raw file and the standardised copy, credited to Efron and others. The page gives no units and no account of how the patients were chosen.
Allen Downey, Think Stats, third edition, chapter 1: an exploratory analysis begins by loading and validating the data against its documentation before choosing summaries.