Three rules for flagging an unusual value disagree about the penthouse. Learn the fences, the z-score and the modified z-score, prove why no z-score among nine values can pass 2.67, and follow a habit for flagged values: check, keep, report with and without, or take logs.
Flag unusual values with the fences, the z-score with cut-off 3 and the modified z-score with cut-off 3.5, and compute all three by hand.
Prove that no z-score among n values can exceed (n − 1)/√n, and explain why this makes the z-score useless in small samples.
Compute the median absolute deviation of a small data set and use it in the modified z-score.
Decide what to do with a flagged value: check the record, keep a genuine value and report resistant summaries with and without it, or work with the base-10 logarithms of the values.
In review. The maths and code on this page are checked by automated tests on every change, but an independent reader has not signed it off yet. Spot a mistake or a confusing step? Tell us.
The question
The penthouse rents for 3,000 euros a month, three times the mean of the nine flats. The fences of the last lesson flag it. The z-score, the yardstick many people reach for first, gives it 2.5, short of the usual cut-off of 3, and says it is ordinary. Which rule is right, and once a value is flagged, what should you do with it, knowing that a model fitted by squared error will bend towards it?
From the last lesson
1. What are the fences of the nine rents, and how are they computed?
2. Where does the upper whisker of the rents end, and why not at 14.5?
Show answer
At 12, the largest rent at or below the upper fence. A whisker stops at a data value; no flat rents for 14.5.
Intuition
An outlier is a value far from the bulk of the others. “Far” needs a ruler, and there are three common ones. Each measures distance from a centre in units of a spread:
the fences measure from the quartiles in units of the IQR;
the z-score measures from the mean in units of the standard deviation;
the modified z-score measures from the median in units of the median absolute deviation.
S01.4.4-F1
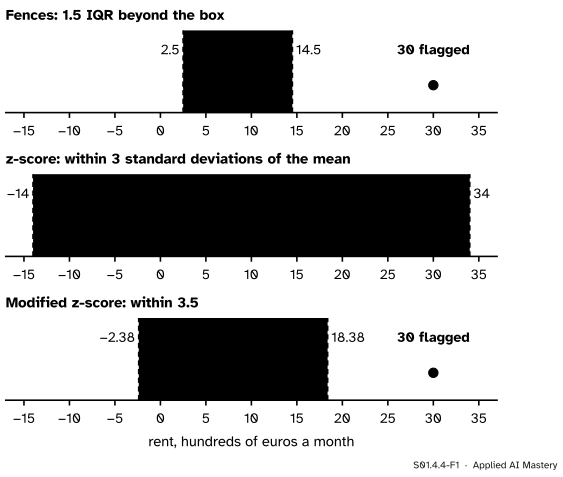
Three rulers for the nine rents. The fences and the modified z-score leave the penthouse outside their band; the z-score’s band is so wide that it passes.
Why does the z-score’s band reach from \(-14\) to 34? Because its centre and its unit, the mean 10 and the standard deviation 8, were computed with the penthouse in them. The penthouse drags the mean up and swells the standard deviation, and is then measured with that swollen unit. It is like asking a suspect to bring the ruler. The quartiles, the median and the MAD barely notice one extreme value, so their rulers are fair.
Build it up
Step 1. The fences. From S01.4.3: anything below 2.5 or above 14.5 is flagged. The penthouse is.
Step 2. The z-score. From S01.3.4, \({z = (x - \bar{x})/s}\). A common rule flags \(|z| > 3\). For the penthouse, \({z = (30 - 10)/8 = 2.5}\): not flagged.
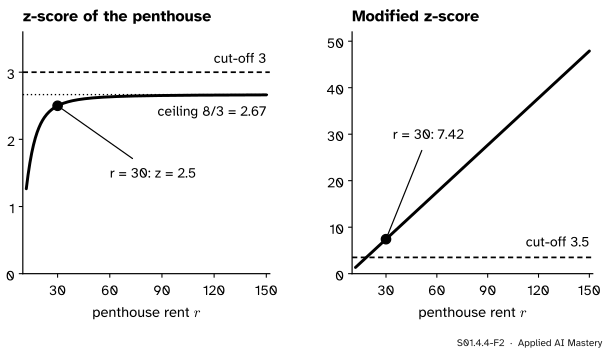
Step 3. Let the penthouse’s rent grow. Keep the other eight rents and raise the penthouse’s rent \(r\). If the z-score were a fair ruler, a large enough \(r\) would pass 3. It never does.
S01.4.4-F2
Raise the penthouse’s rent and its z-score creeps towards 8/3 = 2.67 but never reaches 3. Its modified z-score grows in step with the rent.
At \({r = 60}\) the z-score is 2.63, at \({r = 300}\) it is 2.666. Each increase in \(r\) moves the mean and the standard deviation up with it, and the ratio settles at a ceiling. The next section proves that ceiling.
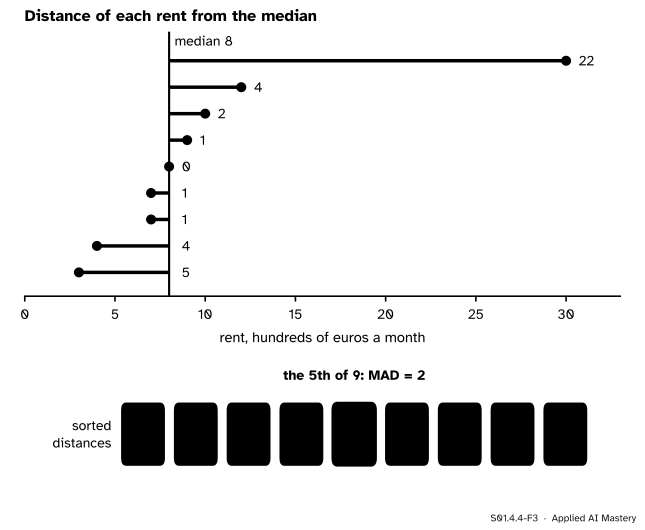
Step 4. A resistant ruler. Use the median as the centre and, as the unit, the median absolute deviation (MAD): the median of the distances from the median. For the rents the median is 8, the distances are 5, 4, 1, 1, 0, 1, 2, 4 and 22, and their median is 2. One huge distance, 22, is just one of nine and cannot move the middle one.
Step 5. The modified z-score. Divide the distance from the median by the MAD and multiply by 0.6745. That constant scales the MAD to match a standard deviation for bell-shaped data, the scaling SciPy applies with scale="normal"; why it is 0.6745 needs the normal curve of M06. The flag is \(|M| > 3.5\). For the penthouse \({M = 0.6745 \times (30 - 8)/2 = 7.42}\): flagged, and by a wide margin.
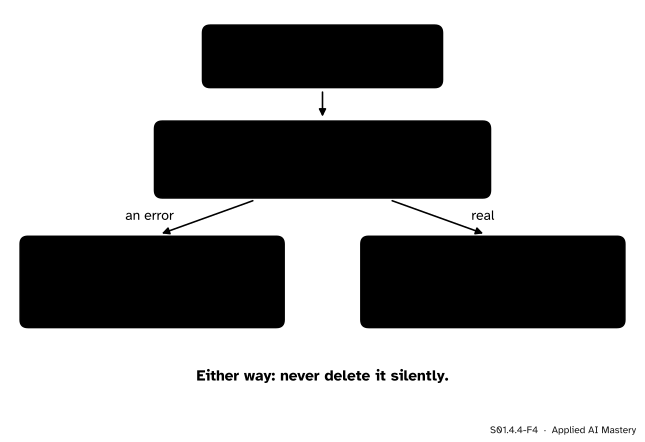
Step 6. Decide. A flag is a question, not a verdict.
S01.4.4-F4
What to do with a flagged value. Check first; fix only from the source; keep what is real; and never delete a value without saying so.
The formal statement
NoteThree flags for a value \(x_i\)
Fences: flag if \({x_i < Q_1 - 1.5\,\mathrm{IQR}}\) or \({x_i > Q_3 + 1.5\,\mathrm{IQR}}\).
z-score: with \({z_i = (x_i - \bar{x})/s}\), flag if \({|z_i| > 3}\).
Modified z-score: with \(\tilde{x}\) the median and MAD the median of the \({|x_i - \tilde{x}|}\),
The modified z-score and its cut-off of 3.5 are the recommendation of Iglewicz and Hoaglin, as NIST’s handbook reports. The modified z-score cannot be computed when more than half the values are equal, because then the MAD is 0.
NoteResult: a ceiling on the z-score
For any \(n\) values that are not all equal, every z-score satisfies
\[
|z_i| \le \frac{n - 1}{\sqrt{n}} .
\]
For \({n = 9}\) the ceiling is \({8/3 = 2.67}\), so no value among nine can pass the cut-off 3, however extreme. For \({n = 10}\) it is 2.85, and only from \({n = 11}\), where it is 3.02, can a z-score pass 3 at all. The z-score is a fair ruler only when one value is too small a part of the data to move the mean and the standard deviation much.
Go deeper: the proof of the ceiling
Write \({d_i = x_i - \bar{x}}\) for the deviations and \({S = \sum d_i^2}\), so that \({s^2 = S/(n-1)}\). Two facts are needed.
Fact 1: the deviations add to zero (S01.3.1). So for any one value \(j\), its deviation is minus the sum of the others: \({d_j = -\sum_{i \ne j} d_i}\).
Fact 2: for any \(m\) numbers \(a_1, \dots, a_m\) with mean \(\bar{a}\),\({\left(\sum a_i\right)^2 \le m \sum a_i^2}\). The squares \({(a_i - \bar{a})^2}\) cannot be negative, and \({\sum a_i = m\bar{a}}\), so
Multiplying by \(m\) and moving the last term across gives Fact 2.
The proof. Apply Fact 2 to the \({m = n - 1}\) deviations other than \(d_j\). Their sum is \(-d_j\) by Fact 1, and their squares add to \({S - d_j^2}\), so
and taking square roots gives \({|z_j| \le (n-1)/\sqrt{n}}\).
When is it reached? Fact 2 is an equality only when every \(a_i\) equals \(\bar{a}\), that is when all the other \(n - 1\) values are equal. Eight rents of 5 and one of 14 give exactly \({z = 8/3}\) for the 14. The penthouse’s z-score only approaches the ceiling as its rent grows, because the other eight rents are not equal.
Worked example
Run the penthouse through all three flags, then decide.
Fences. 30 is above 14.5. Flagged.
z-score. The mean is 10 and, from S01.3.3, the squared deviations add to 512, so \({s^2 = 512/8 = 64}\) and \({s = 8}\). Then \({z = (30 - 10)/8 = 2.5}\), below 3. Not flagged, and it could not have been: the ceiling for nine values is 2.67.
Modified z-score. The median is 8. The MAD comes from the distances to 8.
S01.4.4-F3
The MAD of the nine rents, by hand. The distances from the median 8, sorted: the middle one of nine, the 5th, is 2.
Sorted, the distances are 0, 1, 1, 1, 2, 4, 4, 5, 22, and the 5th of the nine is 2. So \({\mathrm{MAD} = 2}\) and
Check. Is 30 a typing error, say for 3.0? The rest of the row says no: the penthouse has 155 square metres, five rooms and the best energy rating, and a high rent fits. It is a genuine value.
Keep it, and report both ways. With the penthouse the median rent is 8, the mean 10 and the standard deviation 8. Without it the median and the mean are both 7.5 and the standard deviation is 2.98. The median moves by half a unit; the mean by two and a half; the standard deviation shrinks to less than half. A report gives the median as the headline and states the other figures with and without the penthouse, saying why.
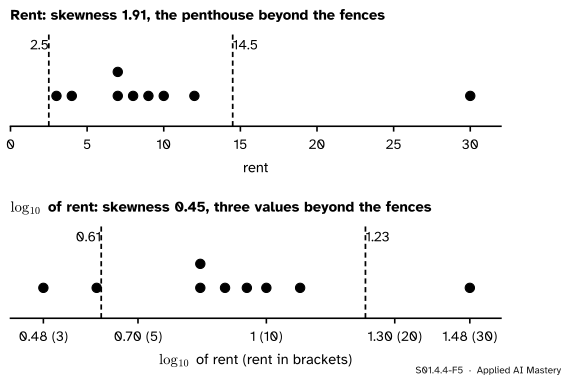
Or change the scale. Rents are ratios at heart: the penthouse costs three times \(Q_3\). The base-10 logarithm of M01.4 turns ratios into distances. The rents become 0.48, 0.60, 0.85, 0.85, 0.90, 0.95, 1, 1.08 and 1.48.
S01.4.4-F5
The rents and their logarithms. The log pulls in the long right tail and stretches the left one: the skewness drops from 1.91 to 0.45.
On the log scale the quartiles are \({\log_{10} 7 = 0.845}\) and \({\log_{10} 10 = 1}\), the IQR is 0.155 and the fences are 0.613 and 1.232. Turned back into rents, those fences are 4.10 and 17.07. The penthouse is still outside, and now so are the two cheapest flats, 3 and 4. A log scale makes the shape more even; it does not make the extremes disappear, and it can change which values the fences flag.
Code
From scratch: the three flags as plain functions.
import statistics as stats_libimport mathrents = [3, 4, 7, 7, 8, 9, 10, 12, 30]def z_scores(xs): m, s = stats_lib.mean(xs), stats_lib.stdev(xs) # stdev divides by n - 1return [(x - m) / s for x in xs]def mad(xs): med = stats_lib.median(xs)return stats_lib.median([abs(x - med) for x in xs])def modified_z(xs): med, d = stats_lib.median(xs), mad(xs)return [0.6745* (x - med) / d for x in xs]def fence_flags(xs): q1, _, q3 = stats_lib.quantiles(xs, n=4, method="inclusive") # the course's rule lo, hi = q1 -1.5* (q3 - q1), q3 +1.5* (q3 - q1)return [x < lo or x > hi for x in xs]z, mz, ff = z_scores(rents), modified_z(rents), fence_flags(rents)print(f"MAD = {mad(rents)}")print(f"penthouse: z = {z[-1]:.2f}, modified z = {mz[-1]:.2f}, beyond a fence: {ff[-1]}")print("flagged by |z| > 3:", [x for x, v inzip(rents, z) ifabs(v) >3]," by |M| > 3.5:", [x for x, v inzip(rents, mz) ifabs(v) >3.5]," by the fences:", [x for x, f inzip(rents, ff) if f])
MAD = 2
penthouse: z = 2.50, modified z = 7.42, beyond a fence: True
flagged by |z| > 3: []  by |M| > 3.5: [30]  by the fences: [30]
Raise the penthouse’s rent and watch the ceiling hold.
for r in [30, 60, 120, 300, 1000]: xs = rents[:-1] + [r]print(f"r = {r:5d} z = {z_scores(xs)[-1]:.4f} modified z = {modified_z(xs)[-1]:7.2f}")print("ceiling (n - 1)/sqrt(n) for n = 9, 10, 11:", [round((n -1) / math.sqrt(n), 3) for n in (9, 10, 11)])
r =    30   z = 2.5000   modified z =    7.42
r =    60   z = 2.6336   modified z =   17.54
r =   120   z = 2.6593   modified z =   37.77
r =   300   z = 2.6656   modified z =   98.48
r =  1000   z = 2.6666   modified z =  334.55
ceiling (n - 1)/sqrt(n) for n = 9, 10, 11: [2.667, 2.846, 3.015]
The library versions, and the two reports.
import numpy as npfrom scipy import statsr = np.array(rents, dtype=float)print("scipy MAD:", stats.median_abs_deviation(r), " z with ddof=1:", stats.zscore(r, ddof=1)[-1].round(3)," z with the default ddof=0:", stats.zscore(r)[-1].round(3))without = r[r !=30]for name, v in [("with F5", r), ("without F5", without)]:print(f"{name:11s} median {np.median(v):4.1f} mean {v.mean():5.2f} s {v.std(ddof=1):5.2f}")logs = np.log10(r)lq1, lq3 = np.quantile(logs, [0.25, 0.75])lo, hi = lq1 -1.5* (lq3 - lq1), lq3 +1.5* (lq3 - lq1)print(f"skewness {stats.skew(r):.2f} -> {stats.skew(logs):.2f} on the log scale")print(f"log fences {lo:.3f}, {hi:.3f}, as rents {10** lo:.2f}, {10** hi:.2f};","flagged:", r[(logs < lo) | (logs > hi)])
scipy MAD: 2.0   z with ddof=1: 2.5   z with the default ddof=0: 2.652
with F5     median  8.0  mean 10.00  s  8.00
without F5  median  7.5  mean  7.50  s  2.98
skewness 1.91 -> 0.45 on the log scale
log fences 0.613, 1.232, as rents 4.10, 17.07; flagged: [ 3.  4. 30.]
Note that scipy.stats.zscore divides by \(n\) unless told ddof=1, which is why it gives 2.65 by default and the course’s 2.5 with ddof=1.
Explore
The module’s interactive, the histogram bin-width explorer, is in S01.4.1. The iris petals in it have no outliers by any of this lesson’s rules. Try the opposite of this lesson there: a value that looks isolated at a narrow bin width may simply be the edge of a clump at a wider one, so look at more than one width before you call a value unusual.
Pitfalls
S01.4.4-F6
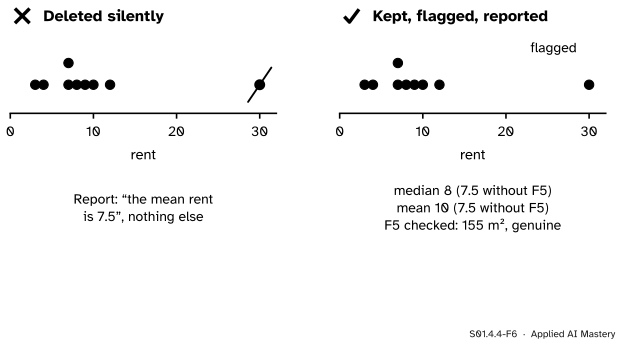
Wrong beside right. Deleting the penthouse and reporting 7.5 hides a decision from the reader. Keeping it, flagging it and reporting both ways lets the reader decide.
“No value has |z| above 3, so there are no outliers.”
With nine values no z-score can pass 2.67, whatever the data. An extreme value inflates the very standard deviation it is measured by. In small samples use the fences or the modified z-score.
“An outlier is an error, so delete it.”
Some are errors, and those are fixed from the source with a note. Many are real: the penthouse is the most interesting flat in the table. Deleting a real value silently changes the answer, here the mean from 10 to 7.5, and the reader never learns why.
“Outliers do not matter to a model.”
A model fitted by squared error is pulled towards them. The mean, the best constant prediction under squared error (S01.3.1), moves from 7.5 to 10 because of one flat, and the least-squares line of ML01.4.1 bends the same way. Decide about such points before training, and say what you decided.
“Taking logs removes outliers.”
It evens out a right-skewed shape. It also stretches the left tail: on the log scale the two cheapest flats fall below the lower fence. Re-check the flags after any change of scale.
Check yourself
Recall
1. Name the three flags of this lesson and their cut-offs.
Show answer
The fences at 1.5 IQR beyond the quartiles; the z-score with \(|z| > 3\); the modified z-score with \(|M| > 3.5\).
2. What is the largest z-score any value among \(n\) values can have?
Show answer
\({(n - 1)/\sqrt{n}}\), which is 2.67 for \({n = 9}\).
3. How is the MAD computed, and what is it for the nine rents?
Show answer
Find the median, take each value’s distance from it, and take the median of those distances. For the rents the distances sorted are 0, 1, 1, 1, 2, 4, 4, 5, 22, so the MAD is 2.
4. Why does the z-score fail to flag the penthouse while the modified z-score flags it?
Show answer
The mean and the standard deviation include the penthouse and are pulled by it, so its z-score is measured with a stretched ruler. The median and the MAD barely move.
5. A flagged value turns out to be genuine. What should a report do?
Show answer
Keep it, say that it was flagged and checked, and give resistant summaries such as the median, with the other summaries both with and without the value. Or analyse the logarithm of the values and re-check the flags there.
Exercises
1.★ Compute the z-score and the modified z-score of the cheapest rent, 3. Is it flagged by any of the three rules?
Show solution
\({z = (3 - 10)/8 = -0.875}\). For the modified z-score the distance from the median is \({3 - 8 = -5}\), so
\[
M = \frac{0.6745 \times (-5)}{2} = -1.69 .
\]
Neither passes its cut-off, and 3 is above the lower fence 2.5. It is not flagged by any rule.
2.★★ What is the smallest number of values for which a z-score of more than 3 is possible? Show the ceiling just below and at that size.
Show solution
The ceiling is \({(n-1)/\sqrt{n}}\), which grows with \(n\). For \({n = 10}\) it is \({9/\sqrt{10} = 9/3.162 = 2.85}\), below 3. For \({n = 11}\) it is \({10/\sqrt{11} = 10/3.317 = 3.02}\), above 3. So eleven values are the fewest for which \(|z| > 3\) can happen, and even then only when the other ten values are nearly equal.
3.★★★ Eight values equal 5 and one equals 14. Compute the z-score of the 14 and show that it equals the ceiling. Then compute the MAD, and say what goes wrong with the modified z-score.
Show solution
The mean is \({(8 \times 5 + 14)/9 = 54/9 = 6}\). The deviations are \(-1\) eight times and \(+8\) once, so the squares add to \({8 \times 1 + 64 = 72}\) and \({s^2 = 72/8 = 9}\), \({s = 3}\). The z-score of 14 is \({(14 - 6)/3 = 8/3}\), exactly the ceiling for \({n = 9}\), as the proof says it must be when all the other values are equal.
The median is 5, and the distances from it are 0 eight times and 9 once, so their median, the MAD, is 0. The modified z-score divides by 0 and is undefined. When more than half the values are equal, the MAD rule cannot be used; fall back on the fences (here \({Q_1 = Q_3 = 5}\), so both fences are 5 and the 14 is flagged) and, above all, look at the values.
Summary card
Flag with a ruler the outlier cannot stretch; check; keep what is real; never delete silently.
S01.4.4-F1
Three rulers, two verdicts.
Fences. Outside \({Q_1 - 1.5\,\mathrm{IQR}}\) to \({Q_3 + 1.5\,\mathrm{IQR}}\).
z-score.\({|z| > 3}\), but \({|z| \le (n-1)/\sqrt{n}}\) always.
Modified z.\({M = 0.6745\,(x - \tilde{x})/\mathrm{MAD}}\), flag \({|M| > 3.5}\).
Decide. Check the record; fix from the source; keep and report with and without; or use \(\log_{10}\).
Sources and next steps
Sources. Each was opened and checked against this lesson on 12 November 2026.
NIST/SEMATECH, e-Handbook of Statistical Methods, section 1.3.5.17, Detection of Outliers. The z-score, the warning that it can mislead in small samples, its maximum \({(n-1)/\sqrt{n}}\), and the modified z-score \({0.6745\,(x_i - \tilde{x})/\mathrm{MAD}}\) with the cut-off 3.5 recommended by Iglewicz and Hoaglin.
SciPy, scipy.stats.median_abs_deviation. The MAD as the median of the absolute deviations from the median, unscaled by default, and scale="normal", which divides by 0.67449.
Allen B. Downey, Think Stats, 3rd edition, chapter 2, Distributions. Outliers as values that may be errors or accurate reports of rare events, with no clear line between them, and the use of domain knowledge to decide.
Next.S01.5 moves from one column to two, where the penthouse returns: one point that makes the correlation of area and rent 0.96 instead of 0.78. In machine learning, the least-squares line of ML01.4 is pulled by such points in the same way the mean is.