Before any average, decide what one row of a table stands for. Read the flats table as units, variables and values, keep the identifier apart, write a data dictionary, and see why a row per district hides the data.
Name the observational unit, the variables and the values of a table, and point to each in the flats table.
Keep an identifier apart from the measurements and say why it is not a variable to analyse.
Recognise a table whose column headers hold values, and rearrange it to one row per unit.
Write a data dictionary that gives every column a meaning, a unit and its allowed values, and check cells against it.
Build a table from a list of dictionaries in plain Python, then check it in pandas with shape, dtypes and head.
In review. The maths and code on this page are checked by automated tests on every change, but an independent reader has not signed it off yet. Spot a mistake or a confusing step? Tell us.
The question
A letting agent sends you nine listings and asks for the typical rent. Before you add anything up, one question decides whether every later number is right: what does one row of the table stand for? A model in machine learning is fed one row at a time, so it inherits whatever answer you give.
Intuition
Here is the table this whole course keeps coming back to. It is an invented example: nine flats to let in one city, with what was recorded about each.
S01.1.1-F1
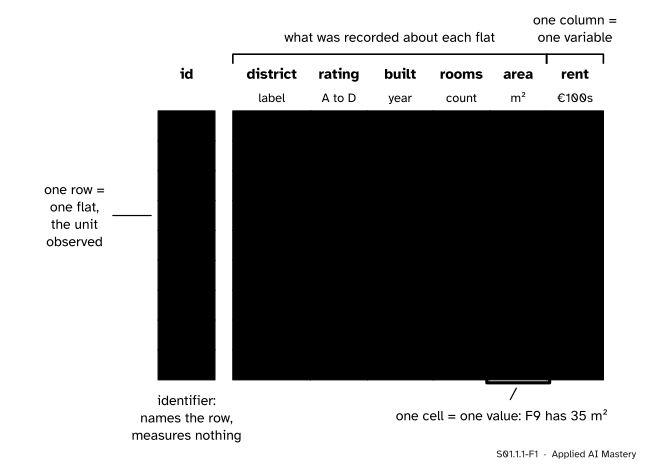
The flats table. Read across, one row is one flat. Read down, one column is one variable. Where a row meets a column sits one value. The identifier on the left names each row and measures nothing.
Three words do all the work.
The observational unit is the thing each row describes. Here it is one flat. In other tables it is a patient, a day, a sale or a photograph.
A variable is one property recorded the same way for every unit: the district, the energy rating, the year built, the number of rooms, the floor area, the monthly rent. Each variable gets one column.
A value is what one variable says about one unit: F9’s area is 35 square metres. Each value gets one cell.
The column id is different. An identifier names a row so that you can find it again, join it to another table or report on it. It is not a property of the flat. Renaming F4 as F44 changes nothing about the flat, so the identifier is kept apart from the variables and is never averaged, compared or fed to a model as if it were a measurement.
Build it up
Step 1. Decide what one row is. The listings could be organised around flats, districts, or viewings booked by tenants. Each choice gives a different table. The question is about rents of flats, so the unit is the flat and the table needs one row per flat.
Step 2. Give each property one column. Every flat has a district, a rating, a year, a number of rooms, an area and a rent, measured the same way. Each becomes a column, and each column holds one kind of value in one unit: rent is always in hundreds of euros a month, never sometimes in euros.
Step 3. Keep the identifier first and apart. It goes in its own column, usually the first, and it is unique: no two rows share an id.
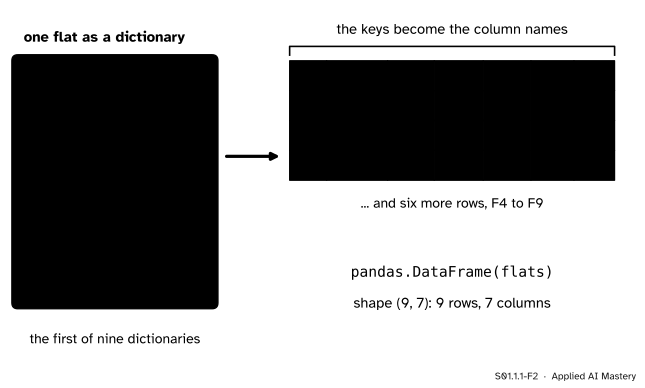
Step 4. Build it in code the same way. One flat is naturally a Python dictionary: each key is a variable and each value is that flat’s value. A list of nine such dictionaries is the table, and pandas turns it into a DataFrame by making the keys into column names.
S01.1.1-F2
One dictionary per flat becomes one row per flat. The keys become the column names, so every row must have the same keys.
Step 5. Count. Nine units and six variables give 54 values, plus nine identifiers. That count matters later: when a cell is empty, it is one of these 54 that is missing (S01.6).
This is the same table that machine learning uses. Lesson ML01.1.2 calls one row an example and one column a feature. If the task were to predict rent, rent would be the label and the other five variables the features. The identifier would be neither.
The formal statement
NoteDefinition: a tidy table
A table is tidy when its layout matches its meaning:
each variable forms a column;
each observation (one unit) forms a row;
each type of observational unit forms its own table.
Any other arrangement is messy.
The three rules are Wickham’s (2014). The second and third say the same thing from two sides: a row is one unit, and one table holds one kind of unit. Facts about districts, such as how many flats each district has in the whole city, describe a different kind of unit and belong in a table of districts, with one row per district.
A tidy table with \(n\) units and \(p\) variables holds exactly \({n \times p}\) values, one per cell. For the flats, \(n = 9\) and \(p = 6\), so there are \({9 \times 6} = 54\) values.
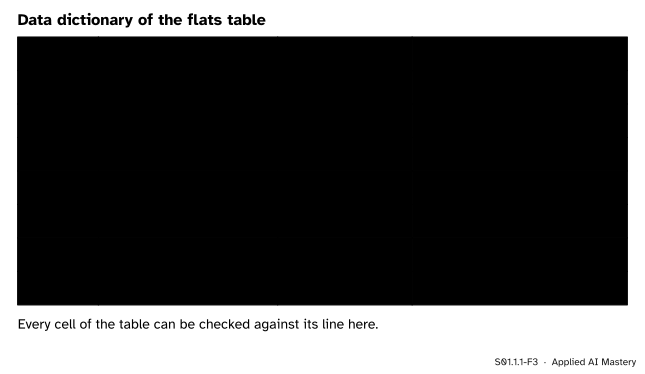
The layout says where each value sits. It does not say what the value means. That is the job of a data dictionary: a short document with one line per column, giving what the column records, its unit and the values it is allowed to take.
S01.1.1-F3
The data dictionary of the flats table. Every one of the 54 values can be checked against its line.
Two lines of the dictionary deserve a remark. Area is given to the nearest 5 square metres, so a flat of 58 square metres appears as 60; lesson S01.1.4 asks what that does to the numbers. Rent is in hundreds of euros, so the 7 in F1’s row means 700 euros a month; a reader without the dictionary would guess wrong by a factor of a hundred.
Worked example
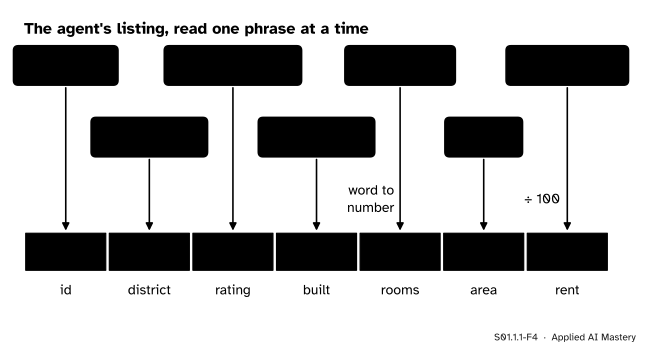
A listing arrives as a sentence. Turn it into a row. The agent’s text for one flat reads: “Listing F2: a flat in the Centre, energy rating B, built in 1996, three rooms, 75 m², €1,200 a month.”
Read it one phrase at a time and ask, for each phrase, which column it fills and whether it needs converting to the unit in the dictionary.
S01.1.1-F4
The listing for F2, read phrase by phrase. Five phrases are copied as they stand; two need work.
“Listing F2” gives the identifier, F2. It goes in id and nowhere else.
“In the Centre” gives the district. The allowed values are Centre, North and South, so it is written exactly as Centre.
“Energy rating B” gives the rating, B, one of the four allowed letters.
“Built in 1996” gives 1996, inside the allowed range of years.
“Three rooms” is a word. The column holds counts, so it becomes the number 3.
“75 m²” is already in square metres and already a multiple of 5, so it is 75.
“€1,200 a month” is in euros, but the column is in hundreds of euros. Divide by 100: the cell holds 12.
The finished row is F2, Centre, B, 1996, 3, 75, 12, which is row F2 of the table. Every one of the six values passed its check in the dictionary.
Code
First in plain Python: the table as a list of dictionaries, one per flat.
units: 9   variables: 6   values: 54
every row has the same columns: True   ids unique: True
The data dictionary becomes a set of rules, one per column, and every cell is checked against its rule. A tenth listing with an area of 62 square metres shows what a failed check looks like.
rules = {"district": lambda v: v in {"Centre", "North", "South"},"rating": lambda v: v in {"A", "B", "C", "D"},"built": lambda v: 1900<= v <=2026,"rooms": lambda v: isinstance(v, int) and v >=1,"area": lambda v: v >0and v %5==0,"rent": lambda v: v >0,}def broken(rows):"""Every (id, column) whose value breaks its rule in the data dictionary."""return [(row["id"], name) for row in rows for name, ok in rules.items() ifnot ok(row[name])]new = {"id": "F10", "district": "North", "rating": "C", "built": 1971, "rooms": 3, "area": 62, "rent": 8}print("the nine flats:", broken(flats))print("with a tenth listing:", broken(flats + [new]))
the nine flats: []
with a tenth listing: [('F10', 'area')]
Now the same table in pandas (P02.4). shape gives rows and columns, dtypes the storage type of each column, and head the first rows. Making id the index sets the identifier apart from the variables, which leaves six columns.
import pandas as pdtable = pd.DataFrame(flats)print("shape:", table.shape)table = table.set_index("id")print("shape with id as the index:", table.shape)print(table.dtypes)print(table.head(3))
shape: (9, 7)
shape with id as the index: (9, 6)
district      str
rating        str
built       int64
rooms       int64
area        int64
rent        int64
dtype: object
   district rating  built  rooms  area  rent
id
F1    North      C   1964      2    55     7
F2   Centre      B   1996      3    75    12
F3    South      D   1932      1    25     3
Last, the layout from the pitfall below: a row per district, with the rents spread across three columns. melt turns it back into one row per value, but it cannot bring back what the layout lost.
wide = pd.DataFrame({"district": ["Centre", "North", "South"],"rent 1": [12, 7, 3], "rent 2": [30, 10, 8], "rent 3": [9, 7, 4]})long= wide.melt(id_vars="district", var_name="position", value_name="rent")print("wide:", wide.shape, " long:", long.shape)print(sorted(long["rent"]) ==sorted(table["rent"]), "- the same nine rents")print(list(long.columns), "- but no id, and no area to go with each rent")
wide: (3, 4)   long: (9, 3)
True - the same nine rents
['district', 'position', 'rent'] - but no id, and no area to go with each rent
Explore
This module’s interactive, the Scale ladder, is in lesson S01.1.3. It works one column of this table at a time, which is only possible because each variable has a column of its own.
Pitfalls
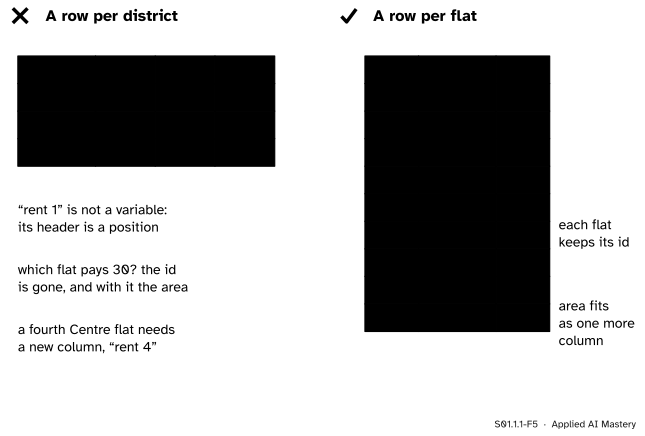
S01.1.1-F5
Wrong beside right. Both hold the same nine rents. Only the table with a row per flat keeps track of which flat each rent belongs to.
“A row per district is shorter, so it is tidier.”
It is shorter because it has thrown information away. Its headers “rent 1”, “rent 2” and “rent 3” are not variables: they only record the order in which flats happened to be typed in, which is what Wickham calls column headers that are values. The flats lost their identifiers, so the 30 can no longer be matched to an area, and a fourth flat in the Centre would need a new column. Keep one row per unit; a summary by district can always be computed from that table, never the other way round.
“The id is just another column of the data.”
An identifier names a row. It measures nothing about the flat, and its values can be changed freely without changing any flat. If ids were the numbers 1 to 9, a model would happily treat them as a feature and might find a pattern in the order the listings were typed. Keep it as the index, or drop it before fitting a model.
“Put everything in one table.”
The number of flats in each district of the whole city is a fact about districts. Copied onto every row, it repeats the same value three times and invites the mistake of averaging it over flats. A second kind of unit gets a second table, joined to the first through the district when needed.
Check yourself
Recall
1. In the flats table, what is the observational unit?
Show answer
One flat. Each row describes one flat to let.
2. What is the difference between a variable and a value?
Show answer
A variable is one property recorded the same way for every unit, and it fills one column. A value is what that variable says about one unit, and it fills one cell.
3. Why is the column id kept apart from the other six?
Show answer
It names the row and measures nothing about the flat. Changing it would change no flat, so it must not be compared, averaged or used as a feature.
4. State the three rules of a tidy table.
Show answer
Each variable forms a column, each observation forms a row, and each type of observational unit forms its own table.
5. What three things does a data dictionary give for every column?
Show answer
What the column records, its unit, and the values it is allowed to take.
Exercises
1.★ A second agent lists a flat as “South, rating C, 1981, two rooms, 48 m², €650”. Write it as a row of the flats table, and say which value breaks the data dictionary.
Show solution
The row (without an id) is South, C, 1981, 2, 48, 6.5. Two conversions were needed: “two rooms” becomes the count 2, and 650 euros becomes 6.5 hundreds of euros. The area breaks the dictionary: the table gives areas to the nearest 5 square metres, so 48 must be recorded as 50.
2.★★ A survey records, for each of 40 tenants, the tenant’s age and the flat they live in, with that flat’s area. Several tenants share a flat. What are the two kinds of unit, and how should the data be laid out as tidy tables?
Show solution
Tenants and flats are two kinds of unit. Age describes a tenant; area describes a flat. A single table with one row per tenant would repeat each flat’s area once for every tenant who lives there, so an average area over that table would count large shared flats several times. Tidy layout: a table of tenants (tenant id, age, flat id) and a table of flats (flat id, area), joined on the flat id when a question needs both.
3.★★★ A tidy table of \(n\) units and \(p\) variables is reshaped into a “long” table with three columns: unit id, variable name and value. How many rows does the long table have? Which operation brings the tidy table back, and what can go wrong if the variables have different units?
Show solution
Each of the \({n \times p}\) values becomes one row, so the long table has \({n \times p}\) rows; for the flats, \({9 \times 6} = 54\). Pivoting on the variable name (in pandas, pivot with the unit id as the index and the variable name as the columns) puts each value back in its cell. The danger is the value column: it now mixes districts, years, square metres and hundreds of euros in one column, so pandas must store it as general objects, and a careless sum or mean over it adds quantities that do not belong together. The long form suits storage; analysis needs the tidy form, where each column has one meaning and one unit.
Summary card
Decide what one row is before you compute anything.
S01.1.1-F1
Row = unit, column = variable, cell = value.
Observational unit: the thing one row describes (one flat).
Variable: one property, one column, one unit throughout.
Tidy: each variable a column, each unit a row, each kind of unit its own table.
Identifier: names a row, measures nothing, is never a feature.
Data dictionary: meaning, unit and allowed values for every column.
Sources and next steps
Sources. Each was opened and checked against this lesson on 12 November 2026.
Hadley Wickham, Tidy Data, Journal of Statistical Software 59(10), 2014. Section 2.2 says every value belongs to a variable and an observation; Section 2.3 gives the three rules of tidy data; Section 3.1 treats column headers that are values, not variable names.
David Diez, Mine Çetinkaya-Rundel and Christopher Barr, OpenIntro Statistics, 4th edition (free PDF). Section 1.2.1 introduces the data matrix: each row a case (observational unit), each column a variable, and the advice to use a data matrix unless there is a very good reason not to.
pandas documentation, DataFrame.melt: unpivots a DataFrame from wide to long format, with id_vars, var_name and value_name.