A boxplot draws the five-number summary as a box, a median line and two whiskers, and marks every value beyond its fences one by one. Name every part, build one by hand for nine rents, and see what the box leaves out.
Name every part of a boxplot and say which number from the five-number summary or the fences draws it.
Compute the fences, the whisker ends and the values drawn on their own for a small data set by hand.
Explain what a boxplot cannot show, such as two clumps or the number of values, and when to draw the data beside it.
Compute a boxplot’s numbers from scratch and with matplotlib.cbook.boxplot_stats.
In review. The maths and code on this page are checked by automated tests on every change, but an independent reader has not signed it off yet. Spot a mistake or a confusing step? Tell us.
The question
A table has thirty numeric columns, and before any model is fitted you want to see each one: where it is centred, how far it spreads, whether it leans, and whether some values sit far out. Thirty histograms are a lot to read. Is there a picture small enough to line up thirty side by side that still marks the unusual values for you?
From the last lesson
1. Read off the staircase of the nine rents: what are \(Q_1\), the median and \(Q_3\)?
Show answer
7, 8 and 10: the staircase first reaches 0.25 at 7, 0.5 at 8 and 0.75 at 10.
2. What share of the nine rents is above 12?
Show answer
\({1 - \hat F(12) = 1 - 8/9 = 1/9}\): only the penthouse.
Intuition
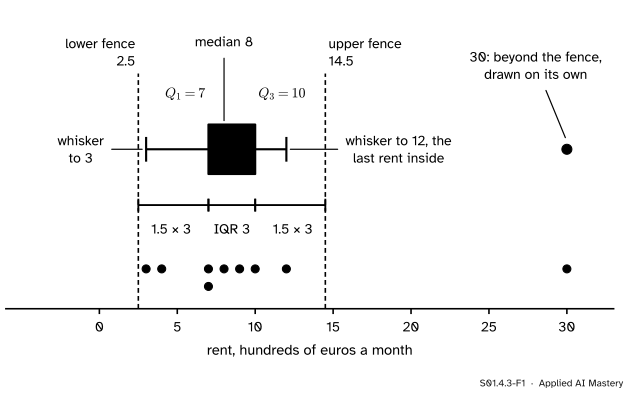
The boxplot, also called a box-and-whisker plot, draws a column from a handful of numbers. The middle half of the values becomes a box, the median a line inside it, and the rest of the values are reached by two whiskers, except for values so far out that they are drawn one by one. Here is every part, drawn for the nine rents.
S01.4.3-F1
The anatomy of a boxplot. The box spans the middle half of the rents, the fences sit 1.5 box-lengths beyond it, the whiskers stop at the last rents inside the fences, and the penthouse is drawn alone.
Each part answers a question at a glance. Where is the middle? At the median line. How spread is the middle half? As wide as the box. Does the column lean? Here the median sits nearer the left of the box and the right whisker is longer, a lean to the right. Is anything unusual? One dot, far beyond the fence.
Build it up
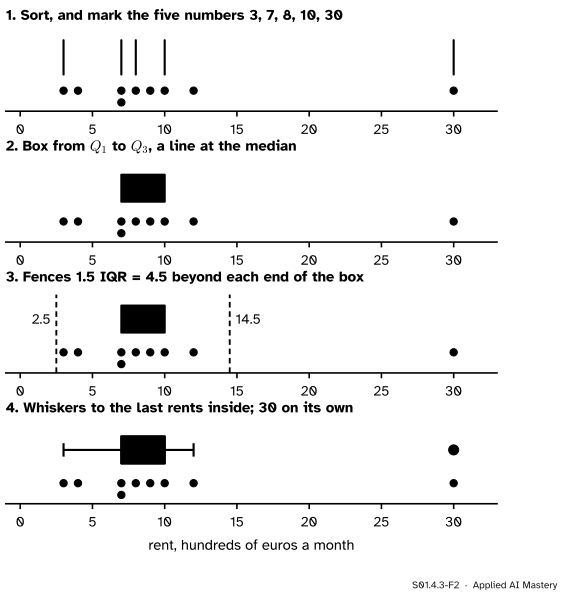
A boxplot is built from the five-number summary of S01.3.2 in four steps.
S01.4.3-F2
Four steps from the sorted rents to the boxplot. Only step 3 adds a new number; step 4 uses it to decide where the whiskers stop.
Step 1. The five numbers. Sort the rents and find the minimum 3, \(Q_1 = 7\), the median 8, \(Q_3 = 10\) and the maximum 30.
Step 2. The box. Draw a box from \(Q_1\) to \(Q_3\) and a line across it at the median. The box’s length is the interquartile range, \({\mathrm{IQR} = Q_3 - Q_1 = 3}\).
Step 3. The fences. Measure 1.5 box-lengths out from each end of the box. These limits are the fences: \({7 - 4.5 = 2.5}\) below and \({10 + 4.5 = 14.5}\) above. Fences are not drawn in the final picture; they are a ruler for the next step.
Step 4. Whiskers and the rest. From each end of the box, draw a whisker out to the last data value inside the fence: down to 3 (the smallest rent at or above 2.5) and up to 12 (the largest rent at or below 14.5). A value beyond a fence is drawn as its own dot. Here that is 30 alone.
The formal statement
NoteDefinition: boxplot (Tukey’s fences)
For values with quartiles \(Q_1\) and \(Q_3\), median \(Q_2\) and \({\mathrm{IQR} = Q_3 - Q_1}\):
the box runs from \(Q_1\) to \(Q_3\), with a line at \(Q_2\);
the lower fence is \({L = Q_1 - 1.5\,\mathrm{IQR}}\) and the upper fence is \({U = Q_3 + 1.5\,\mathrm{IQR}}\);
the lower whisker ends at the smallest value that is at least \(L\), and the upper whisker at the largest value that is at most \(U\);
every value below \(L\) or above \(U\) is drawn on its own.
The constant 1.5 is a convention, the one Tukey used and the default of Matplotlib. NIST’s handbook adds outer fences at 3 IQR and draws values beyond them as larger circles. Lesson S01.4.4 uses the fences as one of three ways to flag a value.
Three facts follow from the definition.
The whiskers never claim a value that is not there. Each whisker ends at an actual data value, so a whisker is never longer than the data reach. It is often shorter than 1.5 IQR: the rents’ upper whisker is 2 long, not 4.5.
The middle half is inside the box. By the quantile rule of S01.3.2, about a quarter of the values lie below \(Q_1\) and about a quarter above \(Q_3\), so the box holds about half of them. For the nine rents, the box from 7 to 10 holds 7, 7, 8, 9 and 10: five of nine.
A lean shows as lopsidedness. If the values above the median are more spread out than those below, the median sits nearer the left of the box and the right whisker is longer. The rents have \({Q_2 - Q_1 = 1}\) and \({Q_3 - Q_2 = 2}\): a lean to the right, the long right tail of S01.3.4.
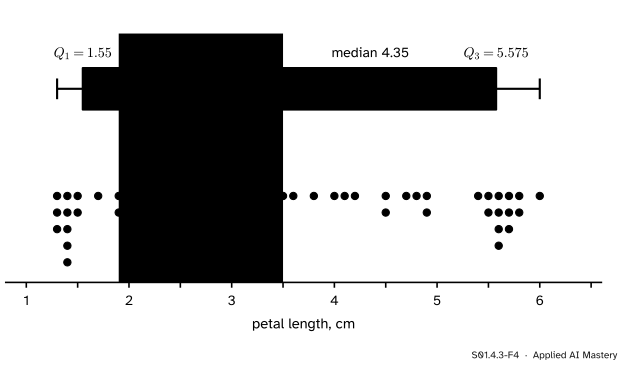
What a boxplot hides. Five numbers cannot hold a whole column. Here are the petal lengths of every fourth flower of the iris data, 38 values with two clumps.
S01.4.3-F4
The box of the 38 petals spans the empty stretch between the two clumps. Nothing in the boxplot shows the gap, or that there are 38 flowers and not 3,800.
The box runs from 1.55 to 5.575 cm, the fences are far beyond the data, and the whiskers reach 1.3 and 6.0. The boxplot looks like one wide, slightly lopsided distribution. The dots show two groups with an empty stretch from 1.9 to 3.5 cm inside the box. A boxplot also never says how many values it summarises: nine rents and nine thousand rents with the same quartiles draw the same box. When the column is small, draw the dots beside the box.
Worked example
Compute every number of the boxplot of the nine rents.
S01.4.3-F3
The worked example as a trace, from the sorted rents to the single value drawn alone.
Quartiles. With nine values the course’s rule puts \(Q_1\), the median and \(Q_3\) at positions \({8 \times 0.25 = 2}\), \({8 \times 0.5 = 4}\) and \({8 \times 0.75 = 6}\) counted from 0: the 3rd, 5th and 7th sorted values, 7, 8 and 10.
Box.\({\mathrm{IQR} = 10 - 7 = 3}\).
Fences.\({1.5 \times 3 = 4.5}\). Then
\[
\begin{aligned}
L &= 7 - 4.5 = 2.5, \\
U &= 10 + 4.5 = 14.5 .
\end{aligned}
\]
Whiskers. The rents at or above 2.5 are all nine; the smallest is 3, so the lower whisker ends at 3. The rents at or below 14.5 are 3, 4, 7, 7, 8, 9, 10 and 12; the largest is 12, so the upper whisker ends at 12.
Values drawn alone. None is below 2.5. Only 30 is above 14.5.
Check the picture against the numbers: the box from 7 to 10 holds five of the nine rents, the whiskers reach two more on the left (3 and 4) and one on the right (12), and one rent is left over, drawn as its own dot. \({5 + 2 + 1 + 1 = 9}\).
Code
From scratch: the course’s quantile rule, then fences, whisker ends and the values beyond.
import mathdef quantile(values, q):"""Position (n - 1) q in the sorted values, counted from 0, with straight-line interpolation.""" xs =sorted(values) pos = (len(xs) -1) * q lo = math.floor(pos) hi =min(lo +1, len(xs) -1)return xs[lo] + (pos - lo) * (xs[hi] - xs[lo])def box_numbers(values, whis=1.5): q1, med, q3 = (quantile(values, q) for q in (0.25, 0.5, 0.75)) iqr = q3 - q1 lower, upper = q1 - whis * iqr, q3 + whis * iqr inside = [x for x in values if lower <= x <= upper]return {"q1": q1, "med": med, "q3": q3, "iqr": iqr, "fences": (lower, upper),"whiskers": (min(inside), max(inside)),"beyond": sorted(x for x in values if x < lower or x > upper)}rents = [3, 4, 7, 7, 8, 9, 10, 12, 30]mine = box_numbers(rents)for key, value in mine.items():print(f"{key:9s}", value)
Matplotlib computes the same numbers with matplotlib.cbook.boxplot_stats, the function that Axes.boxplot calls before it draws. Its whis=1.5 is the 1.5 of the fences.
import numpy as npfrom matplotlib import cbookfrom sklearn.datasets import load_iriss = cbook.boxplot_stats(np.array(rents, dtype=float))[0]print({k: s[k] for k in ("q1", "med", "q3", "iqr", "whislo", "whishi")}, "fliers:", s["fliers"])petals = load_iris().data[::4, 2] # the 38 petals of the figure, in cmp = cbook.boxplot_stats(petals)[0]gap = [x for x in petals if1.9< x <3.5]print(f"petals: Q1 {p['q1']:.3f} median {p['med']:.2f} Q3 {p['q3']:.3f} whiskers {p['whislo']}, {p['whishi']}"f" fliers {len(p['fliers'])} values strictly between 1.9 and 3.5: {len(gap)}")
Drawing is one more call, Axes.boxplot(values); pass whis= to move the fences and orientation="horizontal" to lay the box on its side, as in this lesson’s figures.
Explore
The module’s interactive, the histogram bin-width explorer, is in S01.4.1. It uses the same 38 petals as the figure above. Compare what it shows at a width of about 0.5 with the single box of that figure: the explorer shows the gap that the box covers.
Pitfalls
S01.4.3-F5
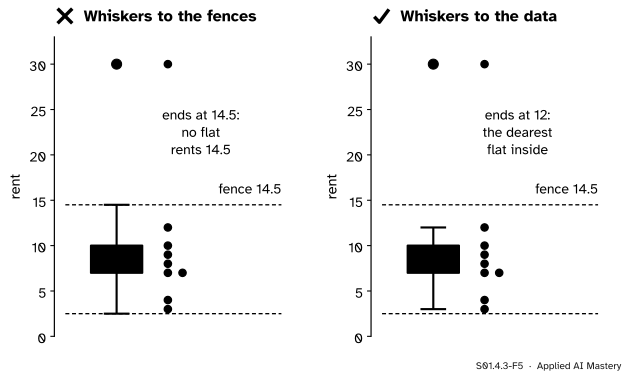
Wrong beside right. A whisker drawn to the fence ends at a rent nobody pays. A whisker drawn to the last value inside ends at a real flat.
“The whiskers are 1.5 IQR long.”
The fences are 1.5 IQR from the box; the whiskers stop at the last data value inside them. Drawn to the fences, the rents’ upper whisker would end at 14.5, where no flat is, and suggest rents between 12 and 14.5 that do not exist.
“The whiskers always go to the minimum and maximum.”
That is a different, simpler plot, the first one NIST’s handbook describes. It hides the penthouse inside a long whisker. Software defaults differ, so say which rule a boxplot uses.
“The median is in the middle of the box.”
Only for a column that is balanced around its median. For the rents it is 1 from \(Q_1\) and 2 from \(Q_3\). The position of the median line is how a boxplot shows a lean.
“Same boxplot, same data.”
The 38 petals draw one wide box over a gap with no flowers in it, and a boxplot never shows how many values it stands for. With small samples, draw the dots too, or a histogram or staircase beside the box.
Check yourself
Recall
1. Which numbers draw the box and the line inside it?
Show answer
The box runs from \(Q_1\) to \(Q_3\); the line is at the median.
2. Give the formulas for the two fences.
Show answer
\({L = Q_1 - 1.5\,\mathrm{IQR}}\) and \({U = Q_3 + 1.5\,\mathrm{IQR}}\), where \({\mathrm{IQR} = Q_3 - Q_1}\).
3. Where does the upper whisker end?
Show answer
At the largest data value that is at most the upper fence. For the rents that is 12.
4. What happens to a value beyond a fence?
Show answer
It is drawn on its own, as a single dot. For the rents only 30 is.
5. Name two things a boxplot cannot show.
Show answer
How many values it summarises, and whether the values form clumps with gaps between them, as the iris petals do.
Exercises
1.★ Draw, in numbers, the boxplot of the nine values 2, 9, 10, 11, 12, 13, 15, 21, 40.
Show solution
With nine values the quartiles are the 3rd, 5th and 7th sorted values: \({Q_1 = 10}\), median 12, \({Q_3 = 15}\), so \({\mathrm{IQR} = 5}\) and \({1.5 \times 5 = 7.5}\). The fences are \({10 - 7.5 = 2.5}\) and \({15 + 7.5 = 22.5}\). The smallest value at or above 2.5 is 9, so the lower whisker ends at 9; the largest at or below 22.5 is 21. Two values are drawn alone: 2 below and 40 above.
2.★★ The penthouse’s rent turns out to be a typing error and is corrected from 30 to 13. Which parts of the rents’ boxplot change? How high could that rent be before it is drawn on its own?
Show solution
Sorted: 3, 4, 7, 7, 8, 9, 10, 12, 13. The 3rd, 5th and 7th values are still 7, 8 and 10, so the box, the median and the fences (2.5 and 14.5) do not change. The upper whisker now ends at 13, the largest value at or below 14.5, and no value is drawn alone. As long as that rent stays the largest value and is at most 14.5, nothing else moves; above 14.5 it is beyond the fence and drawn alone.
3.★★★ Every rent is converted to euros and a fixed fee \(b\) is added, so each \(x\) becomes \({100x + b}\). Show that the quartiles and fences are converted the same way, and that exactly the same flats are drawn on their own. What changes if the factor is negative?
Show solution
Write \({y = ax + b}\) with \({a = 100}\). Multiplying by a positive number and adding a constant keeps the order, so the sorted \(y\) values are \({a x_{(k)} + b}\). The quantile rule interpolates between neighbours: a quartile of \(x\) is \({Q = x_{(j)} + g\,\delta}\), where \({\delta = x_{(j+1)} - x_{(j)}}\) is the gap to the next value. The gap between the same two \(y\) values is \({a\,\delta}\), so the same quartile of \(y\) is
\[
\begin{aligned}
&(a x_{(j)} + b) + g\,a\,\delta \\
&\quad= a\,(x_{(j)} + g\,\delta) + b \\
&\quad= aQ + b .
\end{aligned}
\]
So each quartile becomes \({aQ + b}\). The IQR becomes \({(aQ_3 + b) - (aQ_1 + b) = a\,\mathrm{IQR}}\), and the upper fence becomes \({aQ_3 + b + 1.5\,a\,\mathrm{IQR} = aU + b}\); the lower fence likewise becomes \({aL + b}\). For \({a > 0}\), \({ax + b > aU + b}\) exactly when \({x > U}\), and the same holds at the lower fence, so the same flats are drawn alone. With a negative factor the order reverses: \(Q_1\) and \(Q_3\) swap roles, the boxplot is mirrored, and a value beyond the upper fence ends up beyond the lower one. The same flats are still flagged.
Summary card
A boxplot draws five numbers and marks what lies beyond the fences.
S01.4.3-F1
Box, median, fences, whiskers, the rest.
Box.\(Q_1\) to \(Q_3\), line at the median; length \({\mathrm{IQR} = Q_3 - Q_1}\).
Fences.\({Q_1 - 1.5\,\mathrm{IQR}}\) and \({Q_3 + 1.5\,\mathrm{IQR}}\).
Whiskers. To the last data values inside the fences.
Beyond. Each value outside a fence is drawn alone.
Hidden. Clumps, gaps and the sample size: draw the dots too.
Sources and next steps
Sources. Each was opened and checked against this lesson on 12 November 2026.
NIST/SEMATECH, e-Handbook of Statistical Methods, section 1.3.3.7, Box Plot. The box between the quartiles with the median marked, the simple version with whiskers to the minimum and maximum, and the version with fences at 1.5 and 3.0 IQR, whiskers to the most extreme points inside, and points beyond drawn as small and large circles.
Matplotlib, matplotlib.cbook.boxplot_stats. The whis parameter, default 1.5, with whiskers at the lowest datum above \({Q_1 - 1.5\,\mathrm{IQR}}\) and the highest below \({Q_3 + 1.5\,\mathrm{IQR}}\), described as Tukey’s original definition, and the returned keys q1, med, q3, iqr, whislo, whishi and fliers.
David Diez, Mine Cetinkaya-Rundel and Christopher Barr, OpenIntro Statistics, 4th edition (free PDF). Section 2.1, Examining numerical data, covers box plots at this level.
Next.S01.4.4 Outliers: flag, check, decide asks what to do about the dot drawn on its own, and lesson S01.5.4 lines boxplots up side by side to compare groups.