Sort the values and count to the middle: that is the median, and one wild value cannot drag it. Add the quartiles by a stated rule, then the range, the interquartile range and the five-number summary, and see why textbooks disagree on quartiles.
Find the median of a column with an odd or an even number of values, and explain why one extreme value cannot move it far.
Compute quartiles and other percentiles by the course’s rule: position (n - 1) q in the sorted values, with straight-line interpolation.
Give the range, the interquartile range and the five-number summary of a column.
Explain why different textbooks and programs report different quartiles for the same data.
In review. The maths and code on this page are checked by automated tests on every change, but an independent reader has not signed it off yet. Spot a mistake or a confusing step? Tell us.
The question
Suppose the penthouse’s rent was typed with an extra zero: 300 instead of 30. The mean of the nine rents leaps from 10 to 40, a figure that no flat but one comes near. Is there a “middle” that such a slip cannot move, and how would you say where the middle half of the rents lie?
From the last lesson
1. What do the deviations from the mean always add up to?
Show answer
Zero: \({\sum (x_i - \bar{x})} = {n\bar{x} - n\bar{x}} = 0\). That is why the mean is the balance point.
2. District means 5, 8 and 17 with city shares 0.5, 0.3 and 0.2: what is the city’s mean rent?
Show answer
The weighted mean \({0.5 \cdot 5} + {0.3 \cdot 8} + {0.2 \cdot 17} = 8.3\).
Intuition
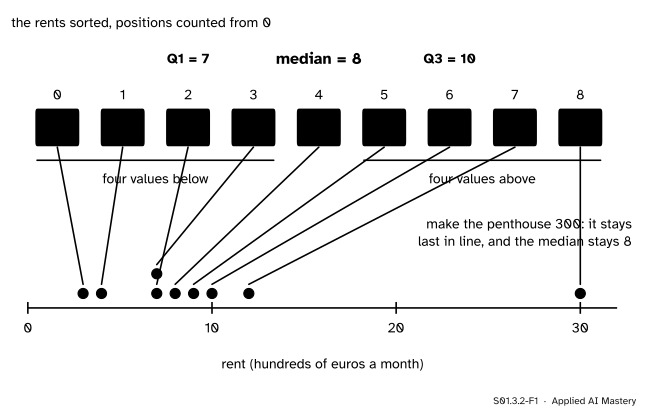
The mean weighs values by how far out they are. The median ignores how far out they are and only counts. Sort the rents from smallest to largest, like people queuing by height, and take the one in the middle of the queue.
S01.3.2-F1
The median is found by position, not by size. Four rents sit below 8 and four above, and the quartiles sit a quarter and three quarters of the way along the queue.
Now make the penthouse 300. It is still last in the queue. Nothing else moves, so the middle of the queue is still the flat paying 8. The median does not care how far the last flat is from the others, only that it is last. That is the whole idea of resistance: a summary is resistant when a few wild values cannot move it far.
The same counting gives more than the middle. A quarter of the way along the queue is the first quartile, three quarters of the way is the third quartile, and between them lies the middle half of the data.
Build it up
Step 1. Sort. The rent column in table order is 7, 12, 3, 10, 30, 8, 9, 4, 7. Sorted, it is 3, 4, 7, 7, 8, 9, 10, 12, 30. Every summary in this lesson starts from the sorted list.
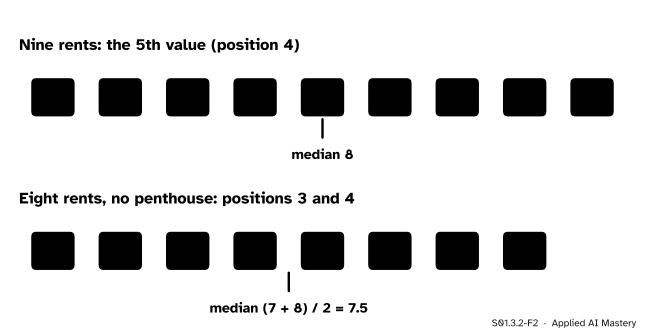
Step 2. Odd count: take the middle value. Nine values have one in the middle, the 5th, with four on each side. The median of the rents is 8.
Step 3. Even count: average the two middle values. Remove the penthouse and eight rents are left. No single value sits in the middle, so take the two that share it, the 4th and the 5th, and average them.
S01.3.2-F2
With an odd count the median is the middle value; with an even count it is halfway between the two middle values.
Compare with the mean. Removing the penthouse moves the median from 8 to 7.5, by half a unit. It moves the mean from 10 to 7.5, by two and a half.
Step 4. The quarter points. The first quartile \(Q_1\) and the third quartile \(Q_3\) cut off the lowest and the highest quarter. For nine sorted values counted from position 0 to position 8, the quarter points are positions 2 and 6: \({Q_1 = 7}\) and \({Q_3 = 10}\). The median is \(Q_2\), at position 4.
Step 5. Two measures of spread. The range is the largest value minus the smallest: \({30 - 3 = 27}\). The interquartile range is \({\text{IQR}} = {Q_3 - Q_1} = {10 - 7} = 3\): the middle half of the rents fit in a band 3 wide. The range is set by the two most extreme values, so the penthouse decides it; the IQR ignores both ends.
Step 6. Five numbers. The minimum, \(Q_1\), the median, \(Q_3\) and the maximum make the five-number summary: 3, 7, 8, 10, 30. It says where the bottom is, where the middle half lies and where the top is. Lesson S01.4.3 draws it as a boxplot.
The formal statement
NoteDefinitions: order statistics, median, quantiles
Sorted from smallest to largest, the values \({x_1, \dots, x_n}\) are written \(x_{(1)} \le x_{(2)} \le \dots \le x_{(n)}\). Count their positions from 0, so position \(k\) holds \({x_{(k+1)}}\).
The median is \({x_{((n+1)/2)}}\) when \(n\) is odd, and \({\tfrac12\,(x_{(n/2)} + x_{(n/2+1)})}\) when \(n\) is even.
The \(q\)-quantile\(Q(q)\), for \(q\) between 0 and 1, sits at position \({p = (n - 1)\,q}\). Write \({p = j + g}\) with \(j\) a whole number and \(g\) the fraction left over; the formula is below.
The quartiles are \({Q_1 = Q(0.25)}\), \({Q_2 = Q(0.5)}\) and \({Q_3 = Q(0.75)}\); the \(k\)-th percentile is \({Q(k/100)}\).
The range is \({x_{(n)} - x_{(1)}}\), the interquartile range is \({Q_3 - Q_1}\), and the five-number summary is \(x_{(1)}, Q_1, Q_2, Q_3, x_{(n)}\).
The quantile goes along a straight line from the value at position \(j\) to the next one:
When \({g = 0}\) the second neighbour is not needed.
The rule agrees with the median. For odd \(n\), the position \({(n-1)/2}\) is a whole number, so \(Q(0.5)\) is the value at that position, the \({((n+1)/2)}\)-th: the middle one. For even \(n\), the position is \({(n - 1)/2 = n/2 - \tfrac12}\): a whole number plus one half. So \({g = \tfrac12}\), and the rule gives the value halfway between the \({(n/2)}\)-th and the \({(n/2+1)}\)-th: the average of the two middle values. For nine values the quartile positions are \({8 \times 0.25 = 2}\) and \({8 \times 0.75 = 6}\), so the quartiles are the 3rd and the 7th sorted values.
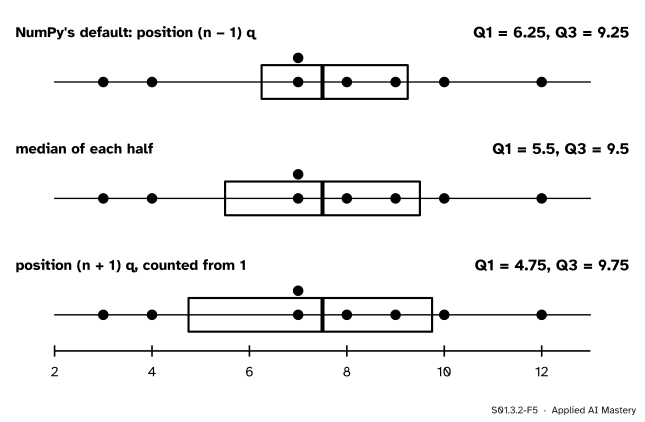
There is more than one rule. The course uses the rule above because it is NumPy’s default, called "linear". NumPy’s documentation lists nine rules, numbered as in a survey by Hyndman and Fan, and four older ones. On large samples they come close together, but on small samples they can disagree, even about the median: the first rule in that list, "inverted_cdf", gives 7 for the median of the eight rents, not 7.5.
S01.3.2-F5
Three common rules, one set of eight rents, three different pairs of quartiles. The median is the same in all three.
The middle row splits the eight rents into a lower half (3, 4, 7, 7) and an upper half (8, 9, 10, 12) and takes the median of each: 5.5 and 9.5. The bottom row places \(Q(q)\) at position \({(n + 1)\,q}\) counted from 1, so \(Q_1\) sits at position \(2.25\), a quarter of the way from 4 to 7. None of these is wrong; they are different conventions. What is wrong is to compare quartiles computed by different rules, or to report a quartile without saying how it was computed when the sample is small.
Why one value cannot move the median far. Change one value, however much. In the sorted list one value leaves and one arrives, so every other value shifts by at most one place. The middle place is then held either by the old middle value or by one of its two neighbours, unless the changed value itself lands between those neighbours. Either way the new median lies between the neighbours of the old one. For the nine rents, whatever happens to one flat, the median stays between 7 and 9. The same argument applies to the quartiles.
Go deeper: the median is the best constant under absolute error
The mean minimises the sum of squared distances (S01.3.1). The median minimises the sum of plain distances, \({\sum \abs{x_i - c}}\). Picture \(c\) sliding right by a small step \(\delta\) with no data value in between. Every value to the left of \(c\) gets \(\delta\) further away, and every value to the right gets \(\delta\) closer. So the total changes by \(\delta\) times (number on the left minus number on the right). While more values lie to the right, sliding right lowers the total; once more lie to the left, it raises it. The total is lowest where the two counts balance, which is the median. For the rents: the total distance to 8 is 40, to 7 or to 9 it is 41, and to the mean, 10, it is 44. This is why a model scored by mean absolute error should predict the median, not the mean.
Worked example
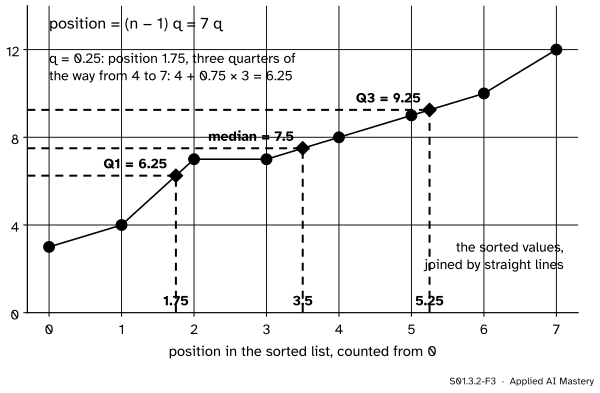
The quartiles of the eight rents left without the penthouse. The sorted values are 3, 4, 7, 7, 8, 9, 10, 12, at positions 0 to 7, and \({n - 1 = 7}\).
S01.3.2-F3
The rule as a picture: join the sorted values by straight lines and read the line at position \(7q\).
\(Q_1\). The position is \({7 \times 0.25 = 1.75}\), so \({j = 1}\) and \({g = 0.75}\). Position 1 holds 4 and position 2 holds 7. Go three quarters of the way from 4 to 7: \({4 + 0.75 \times (7 - 4)} = {4 + 2.25} = 6.25\).
The median. The position is \({7 \times 0.5 = 3.5}\), halfway between positions 3 and 4, which hold 7 and 8. The median is \(7.5\), as in Step 3.
\(Q_3\). The position is \({7 \times 0.75 = 5.25}\), so \({j = 5}\) and \({g = 0.25}\). Positions 5 and 6 hold 9 and 10, and \({{9 + 0.25 \times (10 - 9)} = 9.25}\).
So the IQR is \({{9.25 - 6.25} = 3}\), the same as with the penthouse. Removing the penthouse changed the range from 27 to \({12 - 3 = 9}\), and left the IQR where it was. The five-number summary of the eight rents is 3, 6.25, 7.5, 9.25, 12.
Code
First from scratch: a sort, then the quantile rule exactly as defined.
rents = [7, 12, 3, 10, 30, 8, 9, 4, 7] # F1 to F9, hundreds of euros a monthdef sort(values):"""Insertion sort: take each value and slide it left past every larger one.""" out =list(values)for i inrange(1, len(out)): k = iwhile k >0and out[k -1] > out[k]: out[k -1], out[k] = out[k], out[k -1] k -=1return outdef quantile(values, q):"""The q-quantile: position (n - 1) q in the sorted values, straight line between neighbours.""" s = sort(values) p = (len(s) -1) * q j =int(p) g = p - jif g ==0:return s[j]return s[j] + g * (s[j +1] - s[j])def five_numbers(values): s = sort(values)return [s[0], quantile(s, 0.25), quantile(s, 0.5), quantile(s, 0.75), s[-1]]eight = [r for r in rents if r !=30] # without the penthouseprint("sorted:", sort(rents))print("nine rents: ", five_numbers(rents))print("eight rents:", five_numbers(eight))
Now the library calls. NumPy’s default rule is the one above, and other rules are a method away. For these eight values NumPy’s "midpoint" happens to give the medians of the two halves, and "weibull" is the rule with position \({(n + 1)\,q}\). pandas’ describe reports the five numbers with the count, the mean and the standard deviation.
import numpy as npimport pandas as pdprint(np.median(rents), np.quantile(rents, [0.25, 0.5, 0.75]))for method in ("linear", "midpoint", "weibull"):print(f"{method:>8}:", np.quantile(eight, [0.25, 0.75], method=method))big_slip = [r if r !=30else300for r in rents]print("with 300: mean", np.mean(big_slip), " median", np.median(big_slip))print(pd.Series(rents, name="rent").describe())
8.0 [ 7.  8. 10.]
  linear: [6.25 9.25]
midpoint: [5.5 9.5]
 weibull: [4.75 9.75]
with 300: mean 40.0  median 8.0
count     9.0
mean     10.0
std       8.0
min       3.0
25%       7.0
50%       8.0
75%      10.0
max      30.0
Name: rent, dtype: float64
With the slip to 300 the mean is 40 and the median is still 8. describe uses the same rule as NumPy’s default, so its 25%, 50% and 75% rows are 7, 8 and 10.
Explore
This module’s interactive, Balance and middle, lives in lesson S01.3.3. Drag the penthouse as far as you like and watch the median and the quartile box stay put; then drag a middle flat across the median and watch them move.
Pitfalls
S01.3.2-F4
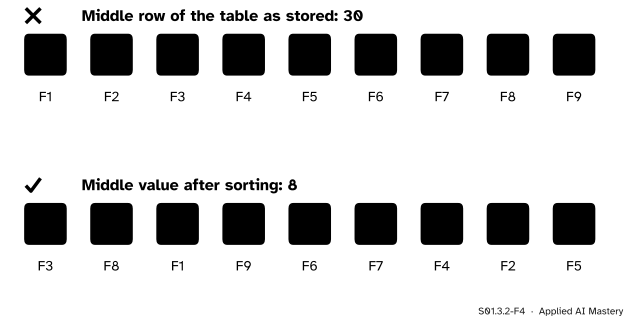
Wrong beside right. The middle row of the table as it happens to be stored is the penthouse. The median is the middle of the sorted values.
“The median is the middle entry of the column.”
Only after sorting. In the table’s own order the fifth row is F5, the penthouse, at 30: the worst possible answer. A spreadsheet sorted by some other column gives yet another “middle”. Sort the values first; numpy.median does this for you.
“There is one correct value for a quartile.”
For the eight rents, common rules give \(Q_1\) = 6.25, 5.5 or 4.75. They are conventions, all defensible. Say which rule you used, use the same rule for every group you compare, and do not check your answer against a textbook that uses another rule.
“The median is resistant, so it is always the better summary.”
It is resistant because it ignores how far out the values are, and that is also information. If you need a total, say the rent bill of all nine flats, only the mean gives it: nine times the mean is 90, while nine times the median, 72, is wrong. A model trained with squared error is pulled towards the mean, not the median, so report what the model is actually estimating.
Check yourself
Recall
1. What is the median of 3, 4, 7, 7, 8, 9, 10, 12, 30, and of the same list without the 30?
Show answer
8, the 5th of nine values; and \({(7 + 8)/2 = 7.5}\), the average of the 4th and 5th of eight.
2. By the course’s rule, at which position (counted from 0) does the \(q\)-quantile of \(n\) values sit?
Show answer
At \({(n - 1)\,q}\), with a straight line between the two neighbouring values when that is not a whole number.
3. What are the five-number summary and the IQR of the nine rents?
4. The penthouse’s rent is mistyped as 300. Which of the mean, the median, the range and the IQR change?
Show answer
The mean (to 40) and the range (to 297). The median stays 8 and the IQR stays 3.
5. Why can two programs give different quartiles for the same eight numbers?
Show answer
Because there are several rules for where a quartile sits between two sorted values, and programs choose different ones. On large samples the rules come close together.
Exercises
1.★ The areas of the nine flats, in square metres, are 55, 75, 25, 60, 155, 70, 35, 30, 35. Give their five-number summary, their range and their IQR.
Show solution
Sorted: 25, 30, 35, 35, 55, 60, 70, 75, 155. For nine values the quartiles are the 3rd and the 7th sorted values and the median is the 5th, so the five-number summary is 25, 35, 55, 70, 155. The range is \({{155 - 25} = 130}\) and the IQR is \({{70 - 35} = 35}\).
2.★★ Find the 10th and the 90th percentiles of the nine rents by the course’s rule.
Show solution
With \({n - 1 = 8}\): the 10th percentile sits at position \({8 \times 0.1 = 0.8}\), between 3 (position 0) and 4 (position 1), so it is \({{3 + 0.8 \times 1} = 3.8}\). The 90th percentile sits at position \({8 \times 0.9 = 7.2}\), between 12 (position 7) and 30 (position 8), so it is \({{12 + 0.2 \times 18} = 15.6}\). The long gap to the penthouse stretches the top percentile.
3.★★★ Compute \({\sum \abs{x_i - c}}\) for the nine rents at \({c = 7}\), \(8\) and \(9\). Then explain, by counting values on each side, why moving \(c\) from 8 to 9 adds exactly 1.
Show solution
At \({c = 7}\) the distances are 4, 3, 0, 0, 1, 2, 3, 5, 23, which add to 41. At \({c = 8}\) they are 5, 4, 1, 1, 0, 1, 2, 4, 22, which add to 40. At \({c = 9}\) they are 6, 5, 2, 2, 1, 0, 1, 3, 21, which add to 41.
Moving \(c\) from 8 to 9 takes it one unit further from each of the five values at or below 8 (3, 4, 7, 7, 8) and one unit closer to each of the four values at or above 9 (9, 10, 12, 30). The total changes by \({{+5 - 4} = +1}\). Moving from 8 to 7 takes it closer to four values and further from five, again \({+1}\). So 8, the median, is the lowest of the three, as the deeper block predicts.
Summary card
The median counts to the middle of the sorted values, so one wild value cannot drag it.
S01.3.2-F1
Sort, then count to the middle.
Median. The middle sorted value, or the average of the two middle values.
Quantile rule. Position \({(n - 1)\,q}\) from 0, straight line between neighbours.
Sources. Each was opened and checked against this lesson on 12 November 2026.
David Diez, Mine Cetinkaya-Rundel and Christopher Barr, OpenIntro Statistics, 4th edition (free PDF). Section 2.1.5 defines the median as the middle observation of the sorted data, or the average of the two middle ones for an even count, and the IQR as \({Q_3 - Q_1}\) with \(Q_1\) and \(Q_3\) the 25th and 75th percentiles. Section 2.1.6 calls the median and the IQR robust statistics, because extreme observations have little effect on them.
NumPy documentation, numpy.quantile: the default method "linear" interpolates at the fractional position \({q\,(n - 1)}\) of the sorted values; the page lists nine methods numbered as in Hyndman and Fan, "inverted_cdf" first and "weibull" sixth, and four older ones kept for backward compatibility, "midpoint" among them.
pandas documentation, Series.describe: for numbers it reports the count, mean, standard deviation, minimum, the 25th, 50th and 75th percentiles and the maximum.
Next.S01.3.3 Variance and standard deviation measures spread with every value, not just the quartiles. Lesson S01.4.3 draws the five-number summary as a boxplot.