Eight students: more study goes with higher scores inside each course, yet with lower scores when the courses are pooled. Split the sum of products into a part inside the groups and a part between them, and see the same reversal in the iris flowers.
Recognise Simpson’s paradox in a scatter plot: a trend that runs one way inside every group and the other way when the groups are pooled.
Derive that the pooled sum of products is a within-group part plus a between-group part, and compute both by hand.
Explain when the pooled trend reverses: the group means line up against the trend inside the groups and the between part outweighs the within part.
Compute pooled and within-group correlations from scratch and with DataFrameGroupBy.corr, on invented points and on scikit-learn’s iris data.
In review. The maths and code on this page are checked by automated tests on every change, but an independent reader has not signed it off yet. Spot a mistake or a confusing step? Tell us.
The question
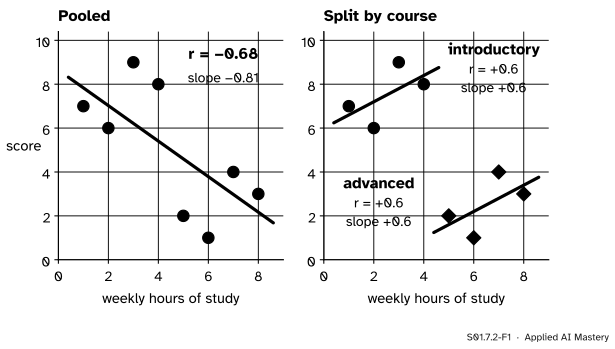
Eight students record their weekly hours of study and their score on a test. Across all eight, the students who study more score lower: the correlation is −0.68. Should a student study less? Split the eight by course and, inside each course, more study goes with higher scores. How can one cloud of points slope down while every part of it slopes up?
From the last lesson
1. How is a treatment’s overall success rate built from its group rates?
Show answer
As a weighted mean, \(p = w_1 p_1 + w_2 p_2\), where \(w_g = n_g / n\) is group \(g\)’s share of the treatment’s patients.
2. Why was open surgery (A) behind overall, though ahead for small and for large stones?
Show answer
Three quarters of A’s patients had large stones, which are harder for either operation, while three quarters of B’s had small ones. A’s overall rate leans on its lower group rate and B’s on its higher one.
Intuition
The eight study points are an invented example. Four students take an introductory course and four take an advanced one. The advanced students study more, because the course demands it, and they score lower, because its test is harder.
S01.7.2-F1
The same eight points, twice. Pooled, the trend falls. Split by course, it rises inside each course.
Look at the left panel and the eye reads one story: more study, lower score. Look at the right panel and it reads another. Inside each course, the student who studied more scored more. The overall downward slope comes from where the two courses sit: the introductory course in the top left, the advanced course in the bottom right.
This is Simpson’s paradox again, with a trend line in place of a success rate. In S01.7.1 the overall rate mixed easy and hard stones. Here the pooled trend mixes two courses whose means line up against the trend inside them.
Build it up
Step 1. Pool. The eight points are \((1, 7)\), \((2, 6)\), \((3, 9)\), \((4, 8)\) for the introductory course and \((5, 2)\), \((6, 1)\), \((7, 4)\), \((8, 3)\) for the advanced one. Their means are \(\bar{x} = 4.5\) hours and \(\bar{y} = 5\) points. Pearson’s correlation over all eight is \(r = -0.68\) (S01.5.2), and the least-squares slope is \(-0.81\) points per hour.
Step 2. Split. Inside the introductory course the means are \((2.5, 7.5)\) and inside the advanced course \((6.5, 2.5)\). Each course on its own has \(r = +0.6\) and slope \(+0.6\).
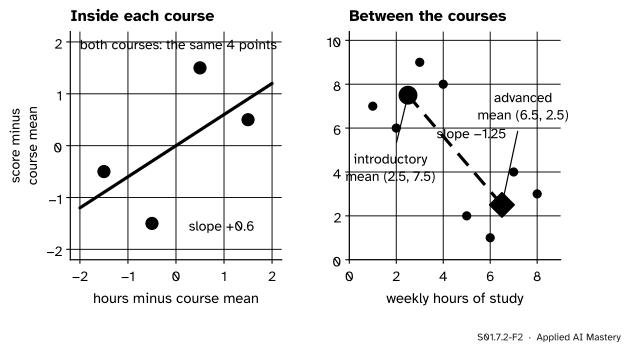
Step 3. Separate the two patterns. Subtract each course’s means from its own points. The two courses land on exactly the same four points, which rise with slope \(+0.6\). What is left over is the two course means, and the line through them falls, with slope \({(2.5 - 7.5) / (6.5 - 2.5)} = -1.25\).
S01.7.2-F2
The pooled cloud as two patterns added together: a rising pattern inside the courses (left) and a falling pattern between the course means (right).
The pooled cloud is both patterns at once, and the between pattern is the bigger one here. The next section measures each pattern with a sum of products and shows exactly when one beats the other.
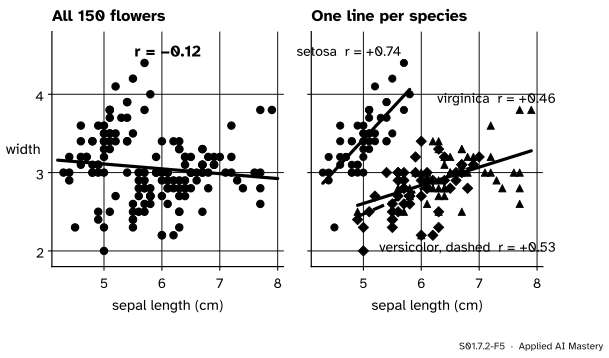
Step 4. The same in real data. scikit-learn ships the iris measurements of 150 flowers, 50 from each of three species. Plot sepal width against sepal length for all 150 and the correlation is \(-0.12\): a faint downward drift. Inside each species it is clearly positive.
S01.7.2-F5
Real flowers, the same reversal. Setosa has short, wide sepals; the other two species have longer, narrower ones, so the species means line up against the trend inside each species.
Inside setosa \(r = +0.74\), inside versicolor \(+0.53\) and inside virginica \(+0.46\). Longer sepals go with wider sepals in every species, but setosa’s sepals are short and wide while the other two species have long, narrow ones.
The formal statement
For points \((x_i, y_i)\), \(i = 1, \dots, n\), with means \(\bar{x}\) and \(\bar{y}\), write the sum of products and the sums of squares as
So \(S_{xy} = {(n - 1)\, s_{xy}}\), the covariance of S01.5.1 before its division. Dividing by \({n - 1}\) cancels from Pearson’s correlation, \(r = S_{xy} / \sqrt{S_{xx} S_{yy}}\), so \(r\) has the sign of \(S_{xy}\). The least-squares slope, \(r\, s_y / s_x\), equals \(S_{xy} / S_{xx}\) and has the same sign too.
Now let the points fall into groups \(g\), with \(n_g\) points and group means \(\bar{x}_g\) and \(\bar{y}_g\).
\(\cdata{W}\), the within part, adds up each group’s own sum of products. \(\cmodel{B}\), the between part, treats each group as \(n_g\) copies of its mean point.
Derivation. Take one point \(i\) in group \(g\) and split its distance from the overall mean in two: from the point to its group mean, then from the group mean to the overall mean.
To shorten the next lines, write \(a_i = {x_i - \bar{x}_g}\) and \(b_i = {y_i - \bar{y}_g}\) for the distances inside the group, and \(c = {\bar{x}_g - \bar{x}}\) and \(d = {\bar{y}_g - \bar{y}}\) for the group’s distances, which are the same for every point of the group. Multiplying out the product of two sums gives four terms:
Add this over the \(n_g\) points of group \(g\). The deviations from a mean add to zero (S01.3.1), so \(\sum_{i \in g} a_i = 0\) and \(\sum_{i \in g} b_i = 0\). The two middle terms therefore vanish, because \(d\) and \(c\) are constant inside the group and come out of the sums:
The last term is the same number \(n_g\) times. So group \(g\) contributes \({\sum_{i \in g} a_i b_i} + {n_g\, c\, d}\). Adding over the groups gives the result.
When the pooled trend reverses. Suppose every group rises, so \(\cdata{W} > 0\). The pooled \(S_{xy}\), and with it the pooled \(r\) and slope, is negative exactly when
\[
\cmodel{B} < -\cdata{W} .
\]
Two things must happen. The group means must line up against the trend, with groups that are further right sitting lower, so that \(\cmodel{B} < 0\). And that between pattern must be strong enough to outweigh the within pattern. If the groups share one mean of \(x\), or one mean of \(y\), then every term of \(\cmodel{B}\) has a zero factor and nothing can reverse.
S01.7.2-F3
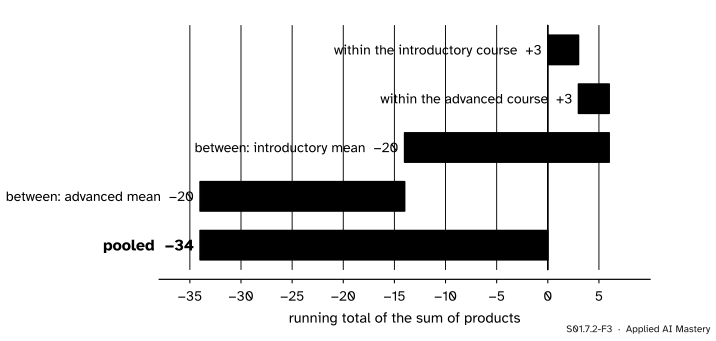
The pooled sum of products of the eight study points, built up piece by piece: the within part is small and positive, the between part large and negative.
Go deeper: the sums of squares split the same way
Put \(y = x\) in the result: \(S_{xx} = W_{xx} + B_{xx}\), with \(W_{xx} = {\sum_g \sum_{i \in g} (x_i - \bar{x}_g)^2}\) and \(B_{xx} = {\sum_g n_g (\bar{x}_g - \bar{x})^2}\). For the study points \(W_{xx} = 5 + 5 = 10\) and \(B_{xx} = {4 \times 2^2} + {4 \times 2^2} = 32\), which add to the pooled \(S_{xx} = 42\). In the same way \(S_{yy} = 10 + 50 = 60\). So the pooled correlation is
Unlike \(\cmodel{B}\), the between part of a sum of squares can never be negative. This split of a sum of squares into within and between parts is the heart of the analysis of variance, which S02 takes up.
Worked example
Split the sum of products of the eight study points.
S01.7.2-F4
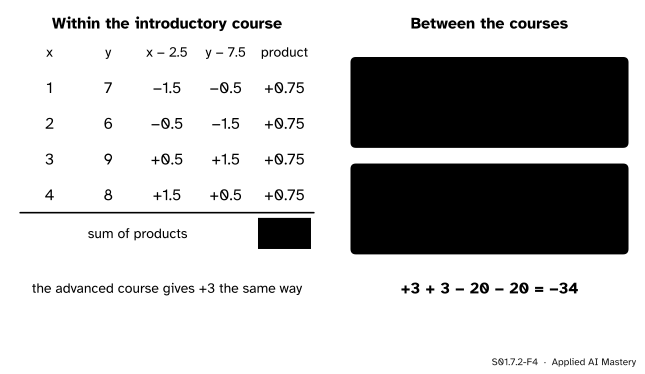
The trace of the worked example: four products inside one course, then two products between the courses, each counted once per student.
Within the introductory course. Its means are \(\bar{x}_1 = (1 + 2 + 3 + 4)/4 = 2.5\) and \(\bar{y}_1 = (7 + 6 + 9 + 8)/4 = 7.5\). The four products of deviations are \({(-1.5)(-0.5)} = 0.75\), \({(-0.5)(-1.5)} = 0.75\), \({(0.5)(1.5)} = 0.75\) and \({(1.5)(0.5)} = 0.75\), which add to \(3\). The advanced course has means \(6.5\) and \(2.5\) and the same deviations, so it also gives \(3\). The within part is \(\cdata{W} = 3 + 3 = 6\).
Between the courses. The overall means are \(4.5\) and \(5\). The introductory mean sits at \({(2.5 - 4.5, 7.5 - 5)} = {(-2, 2.5)}\) from them, a product of \(-5\), and it stands for 4 students: \(-20\). The advanced mean sits at \({(2, -2.5)}\), again a product of \(-5\), times 4: \(-20\). The between part is \(\cmodel{B} = -40\).
Pooled.\(S_{xy} = {6 - 40} = -34\). Check it directly: the deviations of the eight points from \((4.5, 5)\) give the products
The between part is almost seven times the within part and has the opposite sign, so the pooled correlation is negative, \(-34 / \sqrt{42 \times 60} = -0.68\), while each course has \(3 / 5 = 0.6\).
Code
First from scratch with NumPy: the within and between parts, then their sum against the pooled sum of products.
within 6.0  between -40.0  pooled -34.0  within + between -34.0
r pooled -0.68  r inside intro 0.6  pooled slope -0.81
Now with pandas, on the iris flowers. DataFrameGroupBy.corr returns one correlation matrix per group, stacked; the entry we want sits in the sepal-width column of each group’s sepal-length row.
from sklearn.datasets import load_irisiris = load_iris(as_frame=True).frameiris["species"] = iris["target"].map(dict(enumerate(load_iris().target_names)))cols = ["sepal length (cm)", "sepal width (cm)"]pooled_r = iris[cols[0]].corr(iris[cols[1]])inside = iris.groupby("species")[cols].corr().xs(cols[0], level=1)[cols[1]]print("pooled r:", round(pooled_r, 2))print(inside.round(2))x, y, g = iris[cols[0]].to_numpy(), iris[cols[1]].to_numpy(), iris["species"].to_numpy()w_iris =sum(sum_of_products(x[g == s], y[g == s]) for s in np.unique(g))b_iris =sum(50* (x[g == s].mean() - x.mean()) * (y[g == s].mean() - y.mean()) for s in np.unique(g))print("within", round(w_iris, 2), " between", round(b_iris, 2), " pooled", round(sum_of_products(x, y), 2))
pooled r: -0.12
species
setosa        0.74
versicolor    0.53
virginica     0.46
Name: sepal width (cm), dtype: float64
within 13.63  between -19.95  pooled -6.32
For the flowers the within part is \(+13.63\) and the between part \(-19.95\): the species means outweigh the trend inside the species, and the pooled sum of products is \(-6.32\). The drawing call for these pictures would be Axes.scatter once per group; the figures of this lesson are drawn by their own scripts.
Explore
S01.7-X1
Split the scatter
Thirty invented students in two courses. Press Show the two courses, then move course 2 with the sliders and watch the pooled line turn while the line inside each course stays put. Find gaps at which the pooled trend is nearly flat.
Nothing inside either course changes as you move the sliders, so the within part stays at \(+14.3\). Only the between part moves. For two groups of 15 whose means differ by \(a\) hours and \(b\) points, it equals \(7.5\,ab\) (exercise 2 below), so the pooled trend falls as soon as \(ab\) drops below \(-14.3 / 7.5 = -1.9\).
Pitfalls
S01.7.2-F6
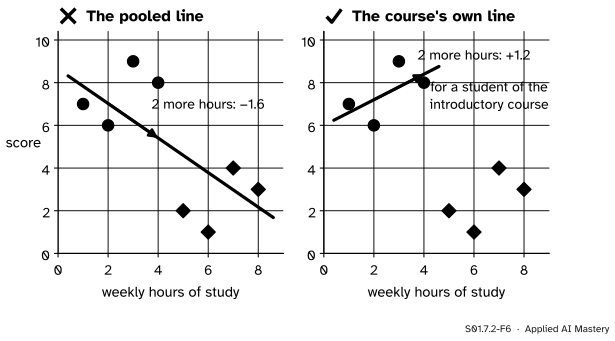
Wrong beside right. For a student of the introductory course, the pooled line predicts a loss of 1.6 points from two more hours of study; the line inside that course predicts a gain of 1.2.
“The pooled trend tells each student what to expect.”
The pooled line describes how scores vary across all students, and most of that variation is between the courses. A student does not change course by studying more. For a student who stays in the introductory course, the trend inside that course is the relevant one.
“A correlation computed on more points is the more trustworthy one.”
The pooled correlation uses all eight points, but it answers a different question: across everyone, do students who study more score more? It does not answer whether more study goes with better scores for students in the same course. More points do not make a question the right one.
“A model can only learn what the columns say.”
True, and that is the danger. A straight line fitted to hours alone learns the pooled slope, −0.81. Give the model the course as a column as well, coded as one indicator column (P02.7.4), and the best line through each course has slope +0.6. Leaving out the column that defines the groups changes the sign of what a model learns.
Check yourself
Recall
1. For the eight study points, what are the correlation and the slope pooled, and inside each course?
Show answer
Pooled: \(r = -0.68\) and slope \(-0.81\). Inside each course: \(r = +0.6\) and slope \(+0.6\).
2. State how the pooled sum of products splits.
Show answer
\(S_{xy} = W + B\): the within part adds up each group’s own sum of products, and the between part adds \({n_g (\bar{x}_g - \bar{x})(\bar{y}_g - \bar{y})}\) over the groups.
3. Why do the two middle terms vanish in the derivation?
Show answer
Inside a group, the deviations from the group mean add to zero, and the other factor of each middle term is the same for every point of the group, so it comes out of the sum.
4. What must the group means do for the pooled trend to reverse a rising trend inside every group?
Show answer
Line up against it, so that groups further right sit lower (\(B < 0\)), and strongly enough that \(B < -W\).
5. What are the pooled and within-species correlations of sepal width with sepal length in iris?
Show answer
Pooled \(-0.12\); inside setosa \(+0.74\), versicolor \(+0.53\) and virginica \(+0.46\).
Exercises
1.★ Group 1 has the points \((1, 3)\) and \((3, 5)\); group 2 has \((5, 1)\) and \((7, 3)\). Compute the within part, the between part and the pooled sum of products, and check the pooled sum directly.
Show solution
Group 1 has means \((2, 4)\) and deviations \((-1, -1)\) and \((1, 1)\), so its products are \(1\) and \(1\): sum \(2\). Group 2 has means \((6, 2)\) and the same deviations: sum \(2\). So \(W = 4\). The overall means are \((4, 3)\). Group 1’s mean sits at \((-2, 1)\) from them, product \(-2\), times 2 points: \(-4\). Group 2’s sits at \((2, -1)\), product \(-2\), times 2: \(-4\). So \(B = -8\) and \(S_{xy} = {4 - 8} = -4\). Directly, the deviations from \((4, 3)\) are \((-3, 0)\), \((-1, 2)\), \((1, -2)\) and \((3, 0)\), with products \(0\), \(-2\), \(-2\) and \(0\), which add to \(-4\). Each group rises, yet the pooled trend falls.
2.★★ Two groups of \(m\) points each have their means a distance \(a\) apart along \(x\) and \(b\) apart along \(y\). Show that the between part is \(B = m\,ab/2\). In the interactive, \(m = 15\) and the within part is \(14.3\): for which products \(ab\) does the pooled trend fall?
Show solution
With equal group sizes the overall mean is halfway between the group means, so one group mean sits at \((-a/2, -b/2)\) from it and the other at \((a/2, b/2)\). Each gives the product \({(a/2)(b/2)} = ab/4\), so
\[
B = m \cdot \frac{ab}{4} + m \cdot \frac{ab}{4} = \frac{m\,ab}{2}.
\]
With \(m = 15\), \(B = 7.5\,ab\). The pooled sum of products \(14.3 + 7.5\,ab\) is negative when \(ab < -14.3 / 7.5 = -1.91\), for example 4 hours apart and more than 0.48 points apart in the opposite direction.
3.★★★ Prove that if every group has the same mean of \(x\), the pooled sum of products equals the within part. Conclude that when the groups are balanced on \(x\) in this way and every group has a positive sum of products, the pooled correlation is positive too.
Show solution
If \(\bar{x}_g = c\) for every group, the overall mean is
so \({\bar{x}_g - \bar{x}} = 0\) for every \(g\). Every term of \(B\) has this factor, so \(B = 0\) and \(S_{xy} = W\). If every group’s own sum of products is positive, \(W\) is a sum of positive numbers and is positive, and so is \(S_{xy}\). The correlation has the sign of \(S_{xy}\), so it is positive. Balancing the groups on \(x\) is what a randomised experiment does with the treatment, which is where S01.7.4 ends up.
Summary card
Pooled trend = trend inside the groups + trend between their means.
S01.7.2-F1
Down when pooled, up inside each course.
Split.\(S_{xy} = W + B\), with \(W\) inside the groups and \(B = {\sum_g n_g (\bar{x}_g - \bar{x})(\bar{y}_g - \bar{y})}\).
Sign. The pooled \(r\) and slope have the sign of \(S_{xy}\).
Reversal. With \(W > 0\), the pooled trend falls when \(B < -W\): the group means line up against the trend and outweigh it.
Here.\({6 - 40} = -34\) for the study points; \({13.63 - 19.95} = -6.32\) for iris.
Sources and next steps
Sources. Each was opened and checked against this lesson on 12 November 2026.
Judea Pearl, Madelyn Glymour and Nicholas P. Jewell, Causal Inference in Statistics: A Primer, chapter 1 (the authors’ copy). Section 1.2, Figures 1.1 and 1.2: the same scatter of exercise against cholesterol, falling inside each age group and rising when the age groups are not shown.
Rafael A. Irizarry, Introduction to Data Science, chapter 19, Association is not causation. Section 19.4 illustrates Simpson’s paradox with simulated variables that are negatively correlated overall and positively correlated inside each stratum of a third variable.
scikit-learn documentation, sklearn.datasets.load_iris: 150 samples in three classes of 50 with four real, positive features, target_names for the class names, and as_frame=True adding a frame attribute that holds the data and the target in one pandas DataFrame.