Numerical variables: counts, measurements and scales
Counts jump, measurements flow. Years built sit on an interval scale and rents on a ratio scale, and the difference decides which statements survive a change of unit. Derive why, climb the ladder of scales, and see why a dtype is not a scale.
Tell a discrete count from a continuous measurement, including a measurement recorded in rounded steps.
Tell an interval scale from a ratio scale by asking whether zero means none of the quantity.
Derive that under a change of unit from x to ax + b a ratio of two values survives only when b = 0, while a ratio of two differences always survives.
Place every column of a table on the ladder of scales and say which statements and summaries it allows.
Explain why a column’s dtype describes how it is stored and not the scale it is on.
In review. The maths and code on this page are checked by automated tests on every change, but an independent reader has not signed it off yet. Spot a mistake or a confusing step? Tell us.
The question
F5 rents for 30 hundred euros and F3 for 3, so F5 costs ten times as much. F5 was built in 2019 and F7 in 1905; is F5 1.06 times as new? And is a 20-degree day twice as warm as a 10-degree day? Every column below holds numbers, yet only some of these sentences are true. Which, and why?
From the last lesson
1. Which of mode, median and mean make sense for district, and which for rating?
Show answer
District: the mode only. Rating: the mode and the median. Neither has a mean.
2. Why does the median rating not depend on which order-keeping codes are used?
Show answer
A recoding that keeps the order keeps the sorted list in order, so the middle of the new list is the recoding of the old middle, C.
Intuition
Lesson S01.1.2 found two kinds of categorical column: names, and names in order. Numbers come in two further kinds, and together the four make a ladder.
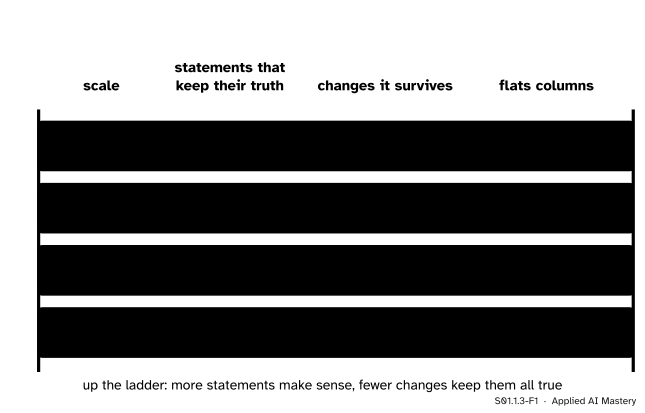
S01.1.3-F1
The ladder of scales. Each rung adds one kind of statement that keeps its truth. In return it allows fewer changes to the values.
Read the ladder as a promise. A column on a rung promises that every statement listed on that rung and below stays true however the values are re-expressed, as long as the re-expression is one the rung allows. Rent is on the top rung: “F5 costs ten times as much as F3” stays true in euros, in hundreds of euros or in any other currency unit. The year built is one rung lower: “F5 was built 114 years after F7” stays true whatever calendar counts the years, but “1.06 times as new” does not survive moving the start of the calendar.
Build it up
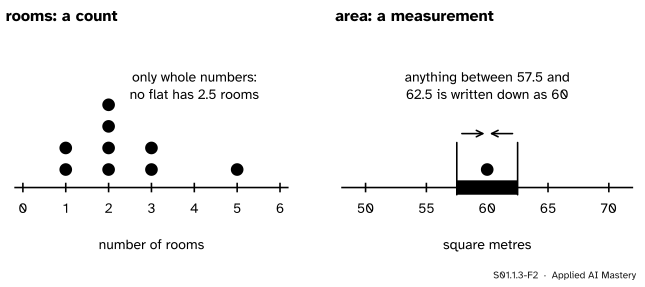
Step 1. Counts and measurements. Rooms is a count: it goes up in whole steps, and no flat has 2.5 rooms. A count is discrete. Area and rent are measurements: a floor could be any size, so they are continuous. Rounding does not change that. The table gives areas to the nearest 5 square metres, so a recorded 60 stands for any area between 57.5 and 62.5.
S01.1.3-F2
A count jumps from one whole number to the next. A measurement can fall anywhere; the table writes it down rounded.
Step 2. Interval or ratio: what does zero mean? On an interval scale, differences mean something but zero is a convention. Year 0 of the calendar is not “no time”, and 0 degrees Celsius is not “no heat”. On a ratio scale, zero means none of the quantity: 0 square metres is no floor, 0 euros is no rent, 0 rooms is no rooms. Counts are on a ratio scale too.
Step 3. Re-expressing the values. Changing the unit of a numerical column means applying \(x \to ax + b\) to every value, with \(a > 0\): multiply by a scale factor \(a\) and add a shift \(b\). Hundreds of euros to euros is \(a = 100, b = 0\). Celsius to Fahrenheit is \(a = 1.8, b = 32\). Counting years from 1900 instead of from year 0 is \(a = 1, b = -1900\).
Step 4. The rungs as sets of changes. A ratio scale allows only \(b = 0\), because its zero is fixed by nature. An interval scale allows any \(b\), because its zero is a convention. An ordinal scale allows any stretch that keeps the order, and a nominal scale any renaming. The derivation below shows which statements each kind of change keeps.
The formal statement
NoteThe four scales (Stevens, 1946)
Scale
Adds the statement
Changes it survives
nominal
same or different
any renaming
ordinal
which is more
any order-keeping stretch
interval
how much more
\(x \to ax + b\), \({a > 0}\)
ratio
how many times
\(x \to ax\), \({a > 0}\)
A statement or summary makes sense for a column when every change its scale allows keeps it true.
Two results decide the top two rungs. Take any change of unit \(x \to ax + b\) with \(a > 0\).
A ratio of two differences always survives. A difference becomes
\[
\begin{aligned}
&(ax_1 + b) - (ax_2 + b) \\
&\quad = a\,(x_1 - x_2).
\end{aligned}
\]
The shift \(b\) cancels. In a ratio of two differences the factor \(a\) appears above and below the line:
So “the gap from \(x_2\) to \(x_1\) is twice the gap from \(x_4\) to \(x_3\)” is true in every unit, provided \(x_3 \neq x_4\).
A ratio of two values survives only when \(b = 0\). Suppose the ratio of two different values \(x_1 \neq x_2\) (with \(x_2 \neq 0\)) is the same before and after the change. Cross-multiplying gives
Since \(x_2 - x_1 \neq 0\), the last line forces \(b = 0\). Conversely, when \(b = 0\) the ratio is \(ax_1 / ax_2 = x_1 / x_2\). So ratios of values survive exactly the changes that keep zero in place, and they make sense only on a ratio scale.
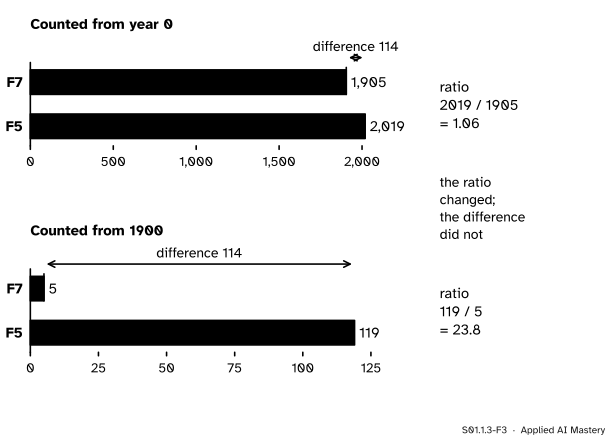
S01.1.3-F3
The years F7 and F5 were built, counted from two different zeros. The difference is 114 years both times; the ratio jumps from 1.06 to 23.8, so it never described the flats.
Placed on the ladder, the flats table reads: id and district nominal, rating ordinal, built interval, rooms, area and rent ratio. A postcode or a telephone area code is made of digits, but it is a name: the difference between two postcodes measures nothing, so a postcode is nominal however it is stored.
Frontier note: what the ladder leaves out
Stevens’ four scales are a guide, not a law. Velleman and Wilkinson (1993) argued that the scale of a variable is not evident from the data alone but depends on the question asked of it, and that software which picks methods from a declared scale type can forbid useful analyses. They recall a finer list from Mosteller and Tukey: names, grades, ranks, counted fractions bounded by 0 and 1, counts, amounts and balances. The ladder is still the right first question to ask of a column.
Worked example
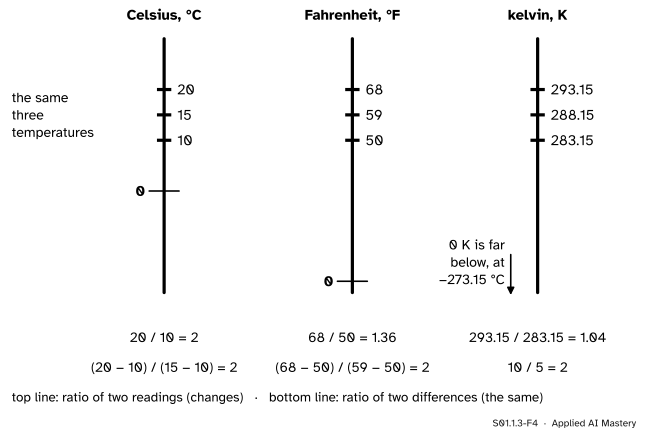
Is 20 °C twice as warm as 10 °C? Convert three temperatures, 10, 15 and 20 °C, to Fahrenheit with \(F = 1.8\,C + 32\) and to kelvin with \(K = C + 273.15\).
S01.1.3-F4
The same three temperatures on three scales. The ratio of two readings changes from scale to scale. The ratio of two differences is 2 on all three.
Kelvin.\(10 + 273.15 = 283.15\), \(288.15\) and \(293.15\).
Ratios of readings. In Celsius, \(20/10 = 2\). In Fahrenheit, \(68/50 = 1.36\). In kelvin, \(293.15/283.15 \approx 1.035\). Three answers to one question: the ratio depends on where each scale put its zero, so “twice as warm” says nothing about the weather.
Ratios of differences. Warming from 10 to 20 compared with warming from 10 to 15: in Celsius \({(20 - 10)/(15 - 10)} = 10/5 = 2\); in Fahrenheit \({(68 - 50)/(59 - 50)} = 18/9 = 2\); in kelvin \(10/5 = 2\). One answer, as the derivation promised.
Celsius and Fahrenheit are interval scales. Kelvin starts at absolute zero, so it is a ratio scale, and on it the absolute temperature of the 20-degree day is only about 3.5 percent higher than that of the 10-degree day.
Code
A unit converter from scratch, and the two results checked with numbers.
def convert(x, a, b=0.0):"""Re-express a value in a new unit: x -> a x + b, with a > 0."""return a * x + bscales = {"C": (1.0, 0.0), "F": (1.8, 32.0), "K": (1.0, 273.15)}for name, (a, b) in scales.items(): t10, t15, t20 = (convert(c, a, b) for c in (10, 15, 20))print(f"{name}: {t10:7.2f}{t15:7.2f}{t20:7.2f} ratio {t20 / t10:.3f} "f"ratio of differences {(t20 - t10) / (t15 - t10):.3f}")
C:   10.00   15.00   20.00   ratio 2.000   ratio of differences 2.000
F:   50.00   59.00   68.00   ratio 1.360   ratio of differences 2.000
K:  283.15  288.15  293.15   ratio 1.035   ratio of differences 2.000
The same checks on the flats. Rent in euros (\(a = 100\)) keeps every ratio; years counted from 1900 (\(b = -1900\)) keep every difference and wreck every ratio.
rent = {"F3": 3, "F5": 30}built = {"F7": 1905, "F5": 2019}euros = {k: convert(v, 100) for k, v in rent.items()}since_1900 = {k: convert(v, 1, -1900) for k, v in built.items()}print("rent ratio:", rent["F5"] / rent["F3"], "in hundreds,", euros["F5"] / euros["F3"], "in euros")print("built ratio:", round(built["F5"] / built["F7"], 2), "from year 0,",round(since_1900["F5"] / since_1900["F7"], 1), "from 1900")print("built difference:", built["F5"] - built["F7"], "and", since_1900["F5"] - since_1900["F7"])
rent ratio: 10.0 in hundreds, 10.0 in euros
built ratio: 1.06 from year 0, 23.8 from 1900
built difference: 114 and 114
The ladder as a data dictionary of scales, and a check of which statements each column allows.
RUNG = {"nominal": 1, "ordinal": 2, "interval": 3, "ratio": 4}NEEDS = {"same or different": 1, "which is more": 2, "how much more": 3, "how many times": 4}scale_of = {"id": "nominal", "district": "nominal", "rating": "ordinal", "built": "interval","rooms": "ratio", "area": "ratio", "rent": "ratio"}def allowed(column):return [s for s, rung in NEEDS.items() if rung <= RUNG[scale_of[column]]]for column in ("district", "rating", "built", "rent"):print(f"{column:9s}", allowed(column))
district  ['same or different']
rating    ['same or different', 'which is more']
built     ['same or different', 'which is more', 'how much more']
rent      ['same or different', 'which is more', 'how much more', 'how many times']
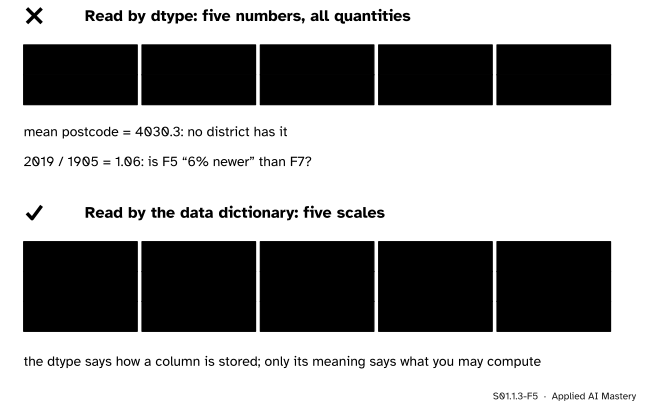
pandas sorts columns by dtype, the way they are stored (P02.1.4). An invented postcode per district shows why that is not the same thing.
['built', 'rooms', 'area', 'rent', 'postcode']
mean postcode: 4030.3  mean rooms: 2.33
['built', 'rooms', 'area', 'rent']
select_dtypes("number") happily returned the postcode and the year, and a mean postcode of 4030.3 belongs to no district. The dtype answered “how is it stored?”; only the data dictionary answers “what may I compute?”.
Explore
S01.1-X1
Scale ladder
Choose a column and a change, then watch the two number lines and the read-out. Start with rent and shift the zero: the gaps survive and the ratio F5 / F3 falls from 10 to 4.38. Then try built with the same change, and rating with a stretch, and find for each column the changes after which everything that makes sense for it still holds.
Pitfalls
S01.1.3-F5
Wrong beside right. Five columns stored the same way sit on three different scales.
“It is stored as a number, so it is a quantity.”
A dtype records storage: 64-bit integers, floating-point numbers, text. Postcodes, years and rents can all be stored as integers, but the first is a name, the second has an arbitrary zero and only the third has a true zero. In machine learning this matters at once: feed a postcode to a model as a number and it will look for a trend from 4011 to 4057 that has no meaning.
“20 degrees is twice as warm as 10 degrees.”
Only on a scale whose zero means no heat. In Fahrenheit the same days are 68 and 50, a ratio of 1.36. On an interval scale, compare differences: “10 degrees warmer” survives every unit.
“The mean of a count must be a whole number.”
The nine flats have 21 rooms between them, a mean of \(21/9 \approx 2.33\) rooms per flat. No flat has 2.33 rooms, and none needs to: the mean is a property of the nine flats together. Counts are on a ratio scale, so their means, differences and ratios all make sense.
Check yourself
Recall
1. Which column of the flats table is a discrete count, and which are continuous measurements?
Show answer
Rooms is a discrete count. Area and rent are continuous measurements, even though the table records them rounded.
2. What separates an interval scale from a ratio scale?
Show answer
On a ratio scale zero means none of the quantity; on an interval scale zero is a convention. So ratios of values make sense only on a ratio scale.
3. Under \(x \to ax + b\), what happens to the difference of two values?
Show answer
It becomes \({a(x_1 - x_2)}\): the shift cancels and the difference is multiplied by \(a\). A ratio of two differences is therefore unchanged.
4. Which changes does each of the four scales survive?
Show answer
Nominal: any renaming. Ordinal: any stretch that keeps the order. Interval: \(x \to ax + b\) with \(a > 0\). Ratio: \(x \to ax\) with \(a > 0\).
5. Why is a postcode nominal even when stored as an integer?
Show answer
Differences and ratios of postcodes measure nothing; a postcode only names an area. The scale comes from what the values mean, not from how they are stored.
Exercises
1.★ Place each on the ladder: the year a car was made, the number of children in a family, a hotel’s star rating, a passport number, a weight in kilograms.
Show solution
Hotel stars: ordinal (more stars is better, but the steps are not measured). Passport number: nominal, an identifier. Number of children: ratio (a count; zero means none). Weight in kilograms: ratio. The year a car was made: interval, like the year a flat was built; differences in years mean something, but year 0 of the calendar is not “no time”.
2.★★ In 2026, F7 (built 1905) is 121 years old and F5 (built 2019) is 7. Is “F7 is about 17 times as old as F5” a statement that makes sense, given that the years built are only on an interval scale?
Show solution
Yes. Age is not the year built: it is a length of time, \(2026 - \text{built}\), measured from the day the flat was finished, and a length of time has a true zero. So age is on a ratio scale and \(121/7 \approx 17.3\) is meaningful for that date. (Stevens makes the same point: dates are interval, periods of time are ratio.) The ratio of the years built, \(2019/1905 \approx 1.06\), still means nothing.
3.★★★ Show that a change \(x \to ax + b\) with \(a > 0\) keeps the order of any two values, and that with \(a < 0\) it reverses it. Then show that the mean survives it: the mean of the new values is \(a\bar{x} + b\).
Show solution
If \(x_1 > x_2\) then \(x_1 - x_2 > 0\), and \({(ax_1 + b)} - {(ax_2 + b)} = {a(x_1 - x_2)}\), which is positive when \(a > 0\) and negative when \(a < 0\). So the order is kept, or reversed.
For the mean of \(n\) values, add up the new values one term at a time:
The mean of the converted values is the converted mean, which is why the mean is a summary that makes sense from the interval rung up.
Summary card
A scale is the set of changes its statements survive.
S01.1.3-F1
Nominal, ordinal, interval, ratio.
Count (rooms) jumps; measurement (area, rent) flows, even when rounded.
Interval (built, °C): zero is a convention; differences mean something, ratios do not.
Ratio (area, rent, rooms, K): zero means none; ratios mean something.
Under \(x \to ax + b\): ratios of differences always survive; ratios of values only when \(b = 0\).
A dtype is not a scale.
Sources and next steps
Sources. Each was opened and checked against this lesson on 12 November 2026.
S. S. Stevens, On the Theory of Scales of Measurement, Science 103 (1946), 677 to 680. Table 1 lists the four scales with their basic operations, their permissible transformations (any one-to-one substitution; any monotonic increasing function; \(x' = ax + b\); \(x' = ax\)) and permissible statistics. The text uses Centigrade and Fahrenheit as interval scales related by \(x' = ax + b\), notes that calendar dates are interval while periods of time are ratio, and uses the numbering of football players as a nominal scale.
David Diez, Mine Çetinkaya-Rundel and Christopher Barr, OpenIntro Statistics, 4th edition (free PDF). Section 1.2.2: a population count is discrete and an unemployment rate continuous, and telephone area codes are not numerical, since their sums, averages and differences have no clear meaning.
National Institute of Standards and Technology, NIST Guide to the SI, Appendix B.8: \({t/°\mathrm{C}} = {(t/°\mathrm{F} - 32)/1.8}\), the kelvin conversion, and the exact factor 0.09290304 square metres per square foot.
pandas documentation, DataFrame.select_dtypes: selects columns by dtype, with "number" for all numeric types.
Paul F. Velleman and Leland Wilkinson, Nominal, Ordinal, Interval, and Ratio Typologies Are Misleading, The American Statistician 47 (1993), 65 to 72: the scale type is not evident from the data independent of the questions asked, and the list of Mosteller and Tukey (names, grades, ranks, counted fractions, counts, amounts, balances).