A missing value is not always a NaN. It can be an empty cell, a -999 or a 0 that passes for data and moves every summary. Learn to unmask stand-ins, count the holes by column and by row, and read the pattern of holes as a picture.
Recognise a missing value in its three forms: NaN, an empty cell, and a stand-in such as -999, 0 or ‘unknown’.
Turn stand-ins into NaN before computing any summary, and show how far one stand-in moves a mean.
Count the holes of a table by column and by row, as numbers and as shares.
Write the indicator table m and group the rows by their pattern of holes to see which columns go missing together.
In review. The maths and code on this page are checked by automated tests on every change, but an independent reader has not signed it off yet. Spot a mistake or a confusing step? Tell us.
The question
A file of flats to let says that one flat was built in the year \({-999}\) and that another has a floor area of \(0\) square metres. Your code reads both as numbers and reports a mean year of \(1638\). Nothing crashed and nothing warned you. How do you find every value that is really missing, including the ones that look like data, before they reach a summary or a model?
Intuition
A table is a promise: one value in every cell. Real tables break that promise. A missing value (a hole) is a cell where the value that should be there was never recorded. Holes come in two kinds. Some show: the cell is empty, or holds the special marker NaN (“not a number”). Others hide: someone typed a number or a word in place of the blank, and that stand-in now passes for data.
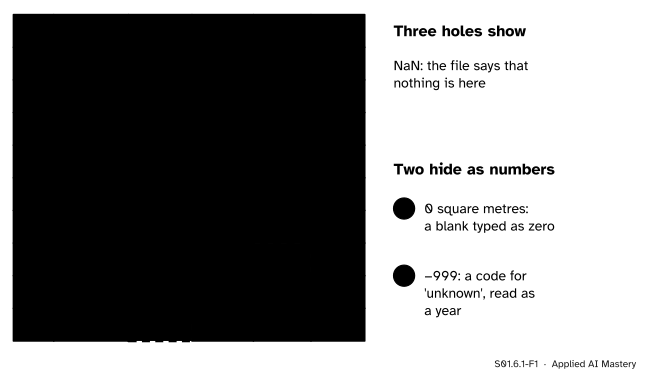
Here is a copy of the course’s flats table (invented, like all its numbers) with five holes put in.
S01.6.1-F1
The flats table with five holes. Three show as NaN. Two hide as numbers: a floor area of 0 and a year built of \({-999}\) are stand-ins for “not known”, and a program reads them as data.
The shown holes are the easy ones: every tool can find a NaN. The hidden ones are the danger. A flat with no floor and a house built in the year \({-999}\) are not data; they are someone’s way of writing “I don’t know”. Finding them takes a human who knows what each column can hold, which is why S01.1 asked for a data dictionary with each column’s allowed values.
Build it up
Step 1. Recall how NaN behaves. P02.5.2 met NaN in NumPy and pandas; in one paragraph: NaN is a float that stands for “no value”. It is not equal to anything, not even itself, so x == float("nan") is always False and you must test with math.isnan or isna. Arithmetic with NaN gives NaN, so numpy.mean of a column with one NaN is NaN, while pandas skips NaN by default (skipna=True) and averages what is left. A program that reads a file usually turns an empty cell into NaN on its own; pandas’ read_csv does this for an empty field and for a short list of words such as NaN, N/A and NULL.
Step 2. Stand-ins are not on that list. A \({-999}\), a \(0\), a \(99\) or the word unknown is read as an ordinary value. Each was a choice made by whoever filled in the file, so each file needs its own list. Typical stand-ins:
an impossible number: \({-999}\), \(9999\), a negative age, a year in the future;
a possible number used as a code: \(0\) for a floor area or a price, \(99\) for an age;
a word: unknown, n/k, -, ?, or an empty string "" in a text column.
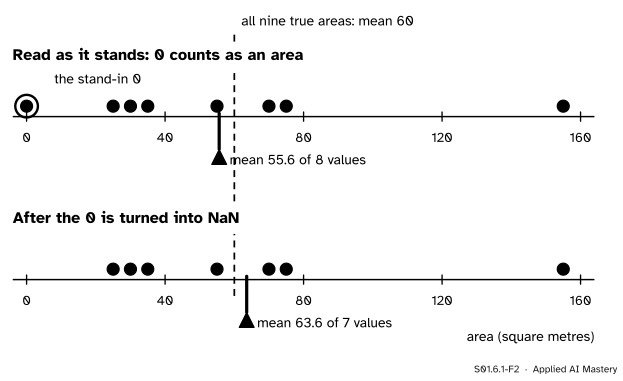
Step 3. A stand-in moves every summary. Take the area column as read. It has one NaN (F4) and one stand-in \(0\) (F7). Averaging what looks like data gives the eight values \(55, 75, 25, 155, 70, 0, 30, 35\), whose sum is \(445\) and mean \({445/8} = 55.6\). Turn the \(0\) into NaN and the mean is over seven areas: \({445/7} = 63.6\).
S01.6.1-F2
One stand-in, two means. Read as an area, the \(0\) pulls the mean down to \(55.6\). Turned into NaN, it is left out and the mean of the seven known areas is \(63.6\). Neither is the \(60\) of all nine true areas, which only an invented table lets us know: lesson S01.6.2 asks why.
The year built is worse, because the stand-in sits far from the real values. With \({-999}\) for F9 the nine years average \(1637.6\); with NaN in its place the eight known years average \(1967.1\). The median hardly notices: it is \(1964\) with the stand-in and \(1969.5\) without it, because one extreme value can shift the middle of the ordered list by at most half a place (S01.3.2). A median that looks sensible beside a mean that does not is a sign of a stand-in.
Step 4. Count the holes. Once every hole is a NaN, counting is mechanical. Count down each column to see which variables are incomplete, and across each row to see which units are.
The formal statement
NoteDefinition: the indicator table
For a table with rows \(i = {1, \dots, n}\) and columns \(j = {1, \dots, k}\), write \(m_{ij} = 1\) when the value in row \(i\) and column \(j\) is missing and \(m_{ij} = 0\) when it is observed. The table of the \(m_{ij}\) is the indicator table of the holes.
Everything in this lesson is a sum over \(m\). The number of holes in column \(j\) and its share are
The share is the mean of the column of \(m\), because the mean of zeros and ones is the share of ones. Across a row the sums run over \(j\) instead: \({\sum_{j} m_{ij}}\) is the number of holes in row \(i\), and row \(i\) is complete when that sum is \(0\). The share of holes in the whole table is the sum of all the \(m_{ij}\) divided by \(nk\).
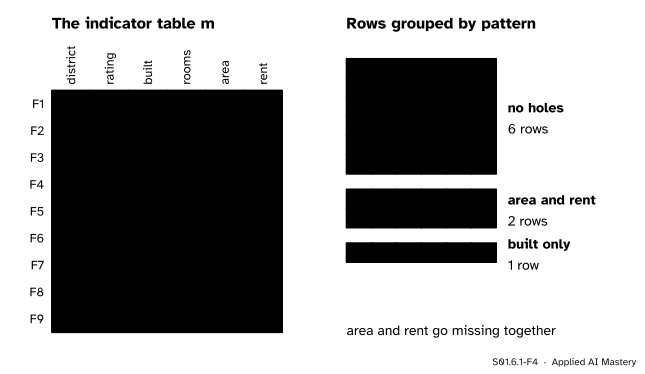
The pattern of row \(i\) is its row of \(m\): which columns it is missing. Sorting the rows by pattern and drawing \(m\) as a grid shows at a glance which columns go missing together.
S01.6.1-F4
Left: the indicator table \(m\). Right: the rows grouped by pattern. Six rows are complete, two lose area and rent together, one loses only its year.
Two columns that go missing together suggest one cause: here, perhaps two listings were copied without their details. That is a question for the next lesson, which asks why values go missing.
Worked example
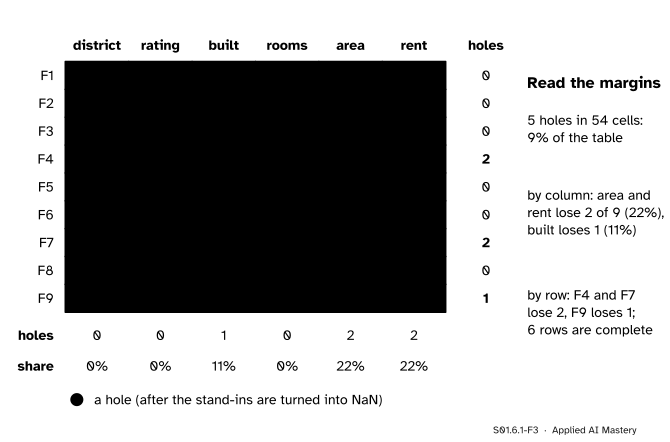
Count the holes of the flats table by column and by row. First turn the two stand-ins into NaN: \({-999}\) in built and \(0\) in area. Then go cell by cell.
S01.6.1-F3
The holes counted down the columns and across the rows. The margins say it all: two columns lose \(22\%\) of their values, one loses \(11\%\), and three of the nine flats are incomplete.
By column. The column sums of \(m\) are \(0\) for district, rating and rooms, \(1\) for built, and \(2\) each for area and rent. As shares of \(9\) rows: \({1/9} = 11.1\%\) and \({2/9} = 22.2\%\).
By row. F4 and F7 miss \(2\) values each and F9 misses \(1\). The other six rows are complete, so \({6/9} = 66.7\%\) of the flats can be used by a method that needs every column.
The whole table. Leaving out the identifier, there are \({9 \times 6} = 54\) cells and \({1 + 2 + 2} = 5\) holes, a share of \({5/54} = 9.3\%\).
Notice how the two views differ. Only \(9.3\%\) of the cells are missing, yet \(33.3\%\) of the rows are incomplete. Holes spread over rows add up fast; lesson S01.6.3 works out how fast.
Code
First from scratch, with the table as a list of dictionaries and the stand-ins listed per column.
import mathnan =float("nan")columns = ["district", "rating", "built", "rooms", "area", "rent"]rows = [ ("F1", "North", "C", 1964, 2, 55, 7), ("F2", "Centre", "B", 1996, 3, 75, 12), ("F3", "South", "D", 1932, 1, 25, 3), ("F4", "North", "B", 1988, 2, nan, nan), ("F5", "Centre", "A", 2019, 5, 155, 30), ("F6", "South", "C", 1975, 3, 70, 8), ("F7", "Centre", "D", 1905, 2, 0, nan), ("F8", "South", "C", 1958, 1, 30, 4), ("F9", "North", "C", -999, 2, 35, 7),]flats = [dict(zip(["id"] + columns, row)) for row in rows]stand_ins = {"built": {-999}, "area": {0}} # from the data dictionary: values that mean 'unknown'def is_missing(column, value):ifisinstance(value, float) and math.isnan(value):returnTrueifisinstance(value, str) and value.strip() in {"", "unknown"}:returnTruereturn value in stand_ins.get(column, set())by_column = {c: sum(is_missing(c, f[c]) for f in flats) for c in columns}by_row = {f["id"]: sum(is_missing(c, f[c]) for c in columns) for f in flats}complete = [name for name, holes in by_row.items() if holes ==0]print("holes by column:", by_column)print("holes by row: ", by_row)print("complete rows:", len(complete), "of", len(flats))areas_as_read = [f["area"] for f in flats ifnot math.isnan(f["area"])]areas_clean = [f["area"] for f in flats ifnot is_missing("area", f["area"])]print(f"area mean as read {sum(areas_as_read) /len(areas_as_read):.1f}, cleaned {sum(areas_clean) /len(areas_clean):.1f}")
holes by column: {'district': 0, 'rating': 0, 'built': 1, 'rooms': 0, 'area': 2, 'rent': 2}
holes by row:    {'F1': 0, 'F2': 0, 'F3': 0, 'F4': 2, 'F5': 0, 'F6': 0, 'F7': 2, 'F8': 0, 'F9': 1}
complete rows: 6 of 9
area mean as read 55.6, cleaned 63.6
Now pandas. The file is read from text, so the empty fields become NaN on their own and the stand-ins do not. DataFrame.replace with a dictionary per column turns the stand-ins into NaN, and isna gives the indicator table \(m\) as True and False.
import ioimport numpy as npimport pandas as pdtext ="""id,district,rating,built,rooms,area,rentF1,North,C,1964,2,55,7F2,Centre,B,1996,3,75,12F3,South,D,1932,1,25,3F4,North,B,1988,2,,F5,Centre,A,2019,5,155,30F6,South,C,1975,3,70,8F7,Centre,D,1905,2,0,F8,South,C,1958,1,30,4F9,North,C,-999,2,35,7"""df = pd.read_csv(io.StringIO(text), index_col="id")print("NaN found as read:", int(df.isna().sum().sum()))print("year built as read: mean", round(df["built"].mean(), 1), " median", df["built"].median())df = df.replace({"built": {-999: np.nan}, "area": {0: np.nan}})m = df.isna() # the indicator tableprint(m.sum()) # holes by columnprint(m.mean().round(3).to_dict()) # shares by columnprint(m.sum(axis=1).to_dict()) # holes by rowprint("share of the table:", round(m.to_numpy().mean(), 3))print(m.value_counts()) # rows grouped by pattern
NaN found as read: 3
year built as read: mean 1637.6  median 1964.0
district    0
rating      0
built       1
rooms       0
area        2
rent        2
dtype: int64
{'district': 0.0, 'rating': 0.0, 'built': 0.111, 'rooms': 0.0, 'area': 0.222, 'rent': 0.222}
{'F1': 0, 'F2': 0, 'F3': 0, 'F4': 2, 'F5': 0, 'F6': 0, 'F7': 2, 'F8': 0, 'F9': 1}
share of the table: 0.093
district  rating  built  rooms  area   rent
False     False   False  False  False  False    6
                                True   True     2
                  True   False  False  False    1
Name: count, dtype: int64
value_counts on the indicator table counts the patterns: six rows with no holes, two missing area and rent, one missing its year. Passing na_values={"built": [-999], "area": [0]} to read_csv would have done the replacement while reading.
Explore
This module’s interactive, the missingness machine, lives in the next lesson, once you know the three ways in which values go missing.
Pitfalls
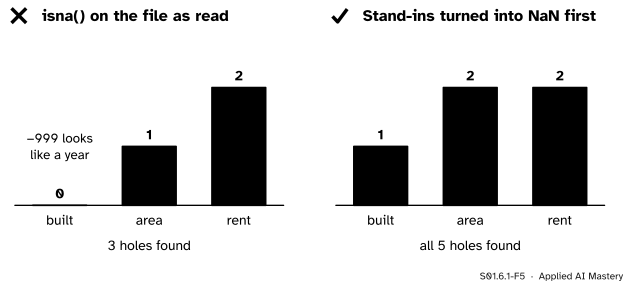
S01.6.1-F5
Wrong beside right. Counting NaN in the file as read finds \(3\) holes. Turning the stand-ins into NaN first finds all \(5\).
“isna().sum() says there are three holes, so there are three.”
isna finds NaN and nothing else. It cannot know that \({-999}\) means “unknown”. Before counting, look at each column’s smallest and largest values and its most common values: a \({-999}\), a \(0\) where \(0\) is impossible, or a value repeated far more often than any other is a suspect.
“A model will not mind a few odd values.”
A model treats a stand-in as a measurement. A year of \({-999}\) becomes a house over two thousand years older than any other, and a model fitted by squared error is pulled hard towards such a point (ML01.4.1). Many libraries also refuse NaN outright, so a stand-in can slip through exactly where a NaN would have raised an error. Unmask stand-ins before any model sees the table.
“Replace every 0 with NaN to be safe.”
A \(0\) is a stand-in only where \(0\) is impossible. A garden of \(0\) square metres, a fee of \(0\) or \(0\) children are real values; turning them into NaN creates holes that were never there. Decide column by column, from the data dictionary.
Check yourself
Recall
1. Name the three forms in which a missing value can appear in a file.
Show answer
As NaN (or another marker the reader recognises), as an empty cell, and as a stand-in: a number or word such as \({-999}\), \(0\) or unknown typed in place of the blank.
2. Why does x == float("nan") never find a NaN?
Show answer
NaN is not equal to anything, itself included, so the comparison is always False. Test with math.isnan(x) or with isna in pandas.
3. What does \(m_{ij} = 1\) mean, and what is the mean of column \(j\) of \(m\)?
Show answer
\(m_{ij} = 1\) means the value in row \(i\), column \(j\) is missing. The mean of column \(j\) of \(m\) is the share of rows missing column \(j\).
4. In the worked example, what share of the cells and what share of the rows have holes?
Show answer
\(5\) of \(54\) cells, \(9.3\%\), and \(3\) of \(9\) rows, \(33.3\%\).
5. With the stand-in, the mean year built is \(1637.6\) against \(1967.1\) without it. Why did the median barely move, from \(1969.5\) to \(1964\)?
Show answer
The stand-in \({-999}\) is one extreme value at the bottom of the ordered list. It moves the sum, and so the mean, a long way. The median only moves by half a place: without the stand-in it lies halfway between the 4th and 5th of the eight years, \(1964\) and \(1975\); with it, it is the 5th of nine, \(1964\).
Exercises
1.★ The rent column as read is \(7, 12, 3\), NaN, \(30, 8\), NaN, \(4, 7\). Give the number of holes, their share, and the mean that pandas reports.
Show solution
Two holes in nine rows, \({2/9} = 22.2\%\). pandas skips them and averages the seven rents: \({7 + 12 + 3 + 30 + 8 + 4 + 7} = 71\), and \({71/7} = 10.14\). NumPy’s mean would return NaN.
2.★★ A survey stores age with \(99\) for “refused”. Of \(200\) answers, \(12\) are \(99\) and the other \(188\) average \(41\). What mean age does a program report if nobody checks, and what is the mean of the known ages?
Show solution
Unchecked, the sum is \({188 \times 41 + 12 \times 99} = {7708 + 1188} = 8896\), and the mean is \({8896 / 200} = 44.48\). With the twelve stand-ins turned into NaN, the mean of the known ages is \(41\). The stand-ins add \(3.48\) years.
3.★★★ Show that the share of holes in the whole table equals the mean of the column shares, when every column has the same \(n\) rows. Check it on the worked example.
Show solution
Write \(p_j = {\frac{1}{n}\sum_i m_{ij}}\) for the share in column \(j\). The share of the whole table is
The first step only splits \({\frac{1}{nk}}\) into \({\frac{1}{k}}\) times \({\frac{1}{n}}\). For the flats, the six shares are \({0, 0, 1/9, 0, 2/9, 2/9}\), whose mean is \({(5/9)/6} = {5/54} = 9.3\%\).
Summary card
Find every hole, including the ones that look like data.
S01.6.1-F1
Three holes show; two hide.
Indicator:\(m_{ij} = 1\) if row \(i\), column \(j\) is missing.
By column: holes \({\sum_i m_{ij}}\), share \({\frac{1}{n}\sum_i m_{ij}}\).
By row: row \(i\) is complete when \({\sum_j m_{ij}} = 0\).
In pandas:replace the stand-ins, then isna().sum(), isna().mean(), isna().sum(axis=1).
Sources and next steps
Sources. Each was opened and checked against this lesson on 12 November 2026.
pandas developers, Working with missing data, pandas 3.1.1 User Guide. Equality comparisons with NaN are false and isna is the way to detect missing values; pandas reductions skip missing values by default while NumPy’s return NaN; and replace turns a value such as \(0\) into NaN.
pandas developers, read_csv, pandas 3.1.1 API reference. The parameter na_values adds strings to recognise as missing, per column when given a dictionary; by default only an empty field and common markers such as NaN, N/A and NULL are read as missing.
Stef van Buuren, Flexible Imputation of Missing Data, second edition, Section 1.1. How software treats missing values by default, and the observation that only 13 of the 510 data sets in one collection declared a code for missing data.