A model is not one rule but a whole family of rules, picked out by a few adjustable numbers. Meet two families, the threshold rule and the straight line, and see why no setting of the knobs can rescue a family that is too simple for the data.
Define a model as a family of functions and name its parameters.
Work out by hand the answer of a threshold rule and of a line for given parameter values.
Find the two parameters of the line that passes through two given examples.
Explain why a family can never fit worse than a smaller family it contains, and recognise data that a family is too simple to fit.
In review. The maths and code on this page are checked by automated tests on every change, but an independent reader has not signed it off yet. Spot a mistake or a confusing step? Tell us.
The question
People say “the model” all day long. Is the model the rule “more than 2.5 exclamation marks means spam”? Or is it the bare idea of drawing a cut, before anyone chose 2.5? The difference decides what a learner is allowed to change, and what it never can.
From the last lesson
1. In the table of a dataset, what are the rows and what are the columns?
Show answer
Rows are examples. Columns are features, and one column is the label.
2. What decides whether a supervised task is classification or regression?
Show answer
What the label means. A category gives classification, and a quantity gives regression.
Intuition
A rule that turns an input into an answer is a function. Lesson 1’s rule was a function with one adjustable number inside it, the cut. Change the number and you get a different function of the same shape.
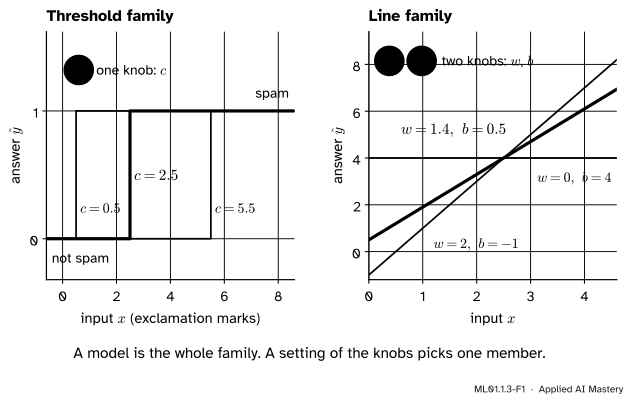
Picture a machine with knobs. Its wiring fixes the shape of what it computes. The knobs choose the particular function. A model is such a machine: a fixed shape with adjustable numbers. The numbers are called parameters, and this lesson calls them knobs as well.
ML01.1.3-F1
Two models. Left: every member of the threshold family is a step from 0 up to 1, and its one knob \(c\) says where the step is. Right: every member of the line family is a straight line, and its two knobs say how steep it is and how high it starts.
Before any data arrives, a model is all of these functions at once. Learning will pick one of them. It can only pick among the functions the model contains.
Build it up
Step 1. A function gives one answer for each input. We write \({\hat{y} = f(x)}\): put the input \(x\) in, get the answer \(\hat{y}\) out.
Step 2. Put a knob on the function. The threshold rule asks “is \(x > c\)?” and answers 1 for yes, 0 for no. The cut \(c\) is a knob.
ML01.1.3-F2
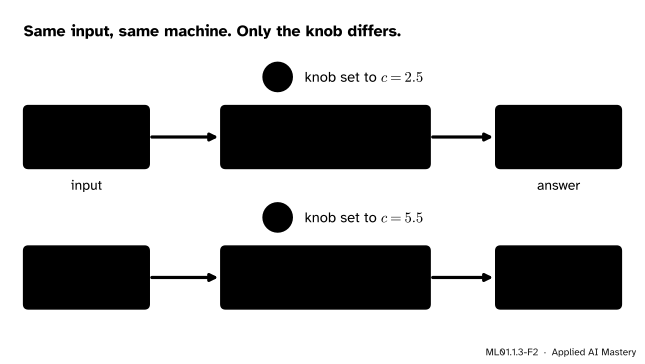
One input, one machine, two settings of the knob. With \(c = 2.5\) the answer to “is \(4 > c\)?” is yes. With \(c = 5.5\) it is no.
Step 3. All the settings together are a family. There is one threshold rule for \(c = 2.5\), another for \(c = 5.5\), and one for every other number. That whole collection is the threshold family. One setting of the knob picks one member.
Step 4. Meet a second family: the line. For a number as the answer, the simplest useful shape is a straight line, \({\hat{y} = wx + b}\). It has two knobs. The slope\(w\) says how much the answer rises when \(x\) goes up by 1. The intercept\(b\) is the answer at \(x = 0\). Turning \(w\) tilts the line. Turning \(b\) lifts it. Every pair \((w, b)\) is one member.
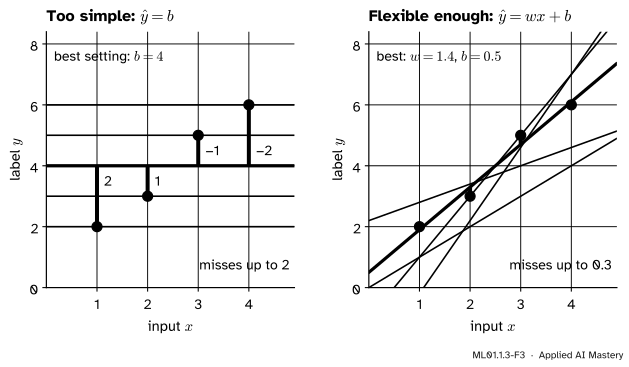
Step 5. A family can be too simple. Freeze the slope at \(w = 0\). What is left is \(\hat{y} = b\), a family of flat lines with one knob. Try both families on the four points of this course, inputs \(1, 2, 3, 4\) with labels \(2, 3, 5, 6\).
ML01.1.3-F3
One dataset, two families. Left: the best flat line still misses by up to 2. Right: once the line may tilt, the best member misses by at most 0.3.
The points rise from left to right, and no flat line can rise. The trouble on the left is not a badly set knob. It is the family. Lesson 4 shows how the best settings in both panels are found.
where the form of \(f\) is fixed and \(\theta\) (the Greek letter theta) stands for the list of its parameters. Each value of \(\theta\) gives one member of the family.
The input changes from example to example. The parameters do not: once set, the same values are used for every input. The three families of this lesson are the threshold rule, the line and the flat line:
So \(\theta\) is \(c\) for the threshold family, the pair \((w, b)\) for the line and \(b\) for the flat line.
The word “model” is used in two ways. Before training it means the family. After training it often means the one member that was chosen, as in “the model predicts 4.7”. Ask which is meant.
Result 1: a family never fits worse than a family inside it. Every flat line is a line: set \(w = 0\). So the line family contains the flat-line family. Take the best flat line, with knob \(b^\star\). The line with \(w = 0\) and \(b = b^\star\) gives the same answers, so it has the same misses. The best line is at least as good as that one line. So the best line is at least as good as the best flat line. This holds for any way of scoring the misses.
Result 2: two examples fix both knobs of a line. Ask for a line through \((x_1, y_1)\) and \((x_2, y_2)\), where \(x_1 \neq x_2\). That is two conditions:
\[
w x_1 + b = y_1, \qquad w x_2 + b = y_2 .
\]
Subtract the first from the second. The \(b\) cancels:
The second line divides both sides by \({x_2 - x_1}\), which is allowed because \(x_1 \neq x_2\). Put this \(w\) into the first condition to get \({b = y_1 - w x_1}\). There is exactly one such line.
Result 3: so a line cannot promise to hit a third example. The line through \((1, 2)\) and \((2, 3)\) has \({w = (3 - 2)/(2 - 1) = 1}\) and \({b = 2 - 1 \cdot 1 = 1}\). At \(x = 3\) it answers \({1 \cdot 3 + 1 = 4}\), but the label is 5. No line passes through all four points. Every member of the line family misses somewhere, and the best one can do is miss by little.
Go deeper: counting what a family is able to say
Give the threshold family the eight messages of lesson 1, with counts \(0, 1, 2, 3, 4, 5, 6, 8\). A rule assigns each message a 0 or a 1, so there are \(2^8 = 256\) possible sets of answers. How many can the family produce?
A cut flags the messages above it. As the cut slides from left to right it passes the eight counts one at a time, and the flagged set shrinks by one message each time. That gives the full set, then 7 messages, 6, and so on down to none: 9 sets of answers out of 256.
A family is simple when it can say few things. That is its weakness, since the truth may not be among the 9. It is also its strength, since 9 candidates are easy to choose between with little data. Exercise 3 counts a richer family, and module ML01.8 weighs the two sides.
Worked example
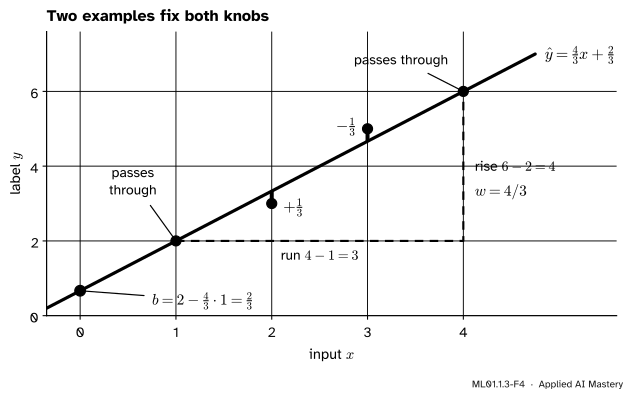
Set the knobs of a line by hand, so that it passes through the first and last of the four points.
The two examples are \((1, 2)\) and \((4, 6)\). By Result 2,
Compare it with three other members, each a different setting of the same two knobs. Each row lists the misses at \(x = 1, 2, 3, 4\) in turn. The code below prints the answers too.
Four members of one family, four different fits. The first row is a flat line, which shows again that the line family contains the flat lines. To say which member is best we need a way to score the misses. That is the subject of lesson 4.
Code
From scratch, a family is a function that takes the input and the knobs.
def threshold_rule(x, c):"""One member of the threshold family: 1 when x is above the cut c, else 0."""return1if x > c else0def line(x, w, b):"""One member of the line family."""return w * x + bprint("input 4, cut 2.5 and cut 5.5:", threshold_rule(4, 2.5), threshold_rule(4, 5.5))xs, ys = [1, 2, 3, 4], [2, 3, 5, 6]for w, b in [(0, 4), (1, 0), (1.4, 0.5)]: answers = [round(line(x, w, b), 2) for x in xs] misses = [round(a - y, 2) for a, y inzip(answers, ys)]print(f"w = {w}, b = {b}: answers {answers}, misses {misses}")
input 4, cut 2.5 and cut 5.5: 1 0
w = 0, b = 4: answers [4, 4, 4, 4], misses [2, 1, -1, -2]
w = 1, b = 0: answers [1, 2, 3, 4], misses [-1, -1, -2, -2]
w = 1.4, b = 0.5: answers [1.9, 3.3, 4.7, 6.1], misses [-0.1, 0.3, -0.3, 0.1]
Result 2 as code, with exact fractions so that nothing is rounded.
from fractions import Fractiondef through(p, q):"""The knobs (w, b) of the line through two points with different inputs.""" (x1, y1), (x2, y2) = p, q w = Fraction(y2 - y1, x2 - x1) # rise over run b = y1 - w * x1 # so that the line passes through the first pointreturn w, bw, b = through((1, 2), (4, 6))print("w =", w, " b =", b)print("answers:", [str(line(x, w, b)) for x in xs])print("misses: ", [str(line(x, w, b) - y) for x, y inzip(xs, ys)])
w = 4/3  b = 2/3
answers: ['2', '10/3', '14/3', '6']
misses:  ['0', '1/3', '-1/3', '0']
In scikit-learn, each family is a class. Calling fit sets the knobs from the data, and they can be read off afterwards. How fit chooses them is the business of lesson 4.
import numpy as npfrom sklearn.dummy import DummyRegressorfrom sklearn.linear_model import LinearRegressionX = np.array(xs).reshape(-1, 1) # one row per example, one feature columnflat = DummyRegressor(strategy="mean").fit(X, ys)straight = LinearRegression().fit(X, ys)print("flat-line family: b =", flat.constant_[0, 0])print("line family: w =", round(straight.coef_[0], 4), " b =", round(straight.intercept_, 4))for name, fitted in [("flat line", flat), ("line", straight)]:print(f"largest miss of the {name}: {np.abs(fitted.predict(X) - ys).max():.2f}")
flat-line family: b = 4.0
line family:      w = 1.4  b = 0.5
largest miss of the flat line: 2.00
largest miss of the line: 0.30
The library returns the two best settings drawn in the figure of Step 5: \(b = 4\) for the flat line, and \(w = 1.4\), \(b = 0.5\) for the line.
Explore
This module’s interactive, Rule versus learner, is in lesson 1. Its slider for the cut is the knob of the threshold family. Slide it from one end to the other and you see every way a member of the family can split the counts from 0 to 10. The bars underneath show how each one fares.
Pitfalls
ML01.1.3-F5
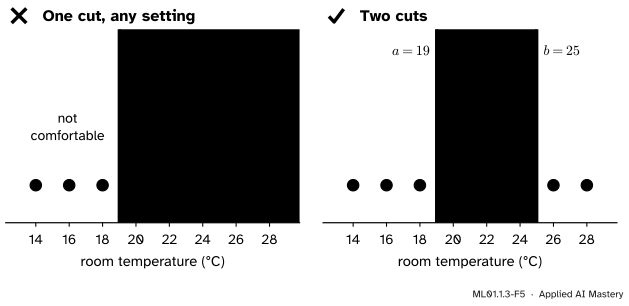
Wrong beside right. The comfortable rooms sit in the middle. One cut can separate left from right, but not middle from ends. A family with two cuts can.
“The fit is poor, so the knob needs more tuning.”
Eight rooms were measured: comfortable at 20, 22 and 24 degrees, not comfortable at 14, 16, 18, 26 and 28. The family “comfortable when the temperature is above \(c\)” makes 2 mistakes at its best setting, \(c = 19\). No amount of tuning helps, because the family is too simple. Change the family to “comfortable when between \(a\) and \(b\)”, and \(a = 19\), \(b = 25\) makes none.
“The input is one of the knobs.”
The input \(x\) belongs to the example and changes with every message. The knobs belong to the model. Once set, they stay the same for every example. Learning adjusts knobs, never inputs.
“More knobs are always better.”
A cubic curve has four knobs, and one setting of them passes through all four points with no miss at all. At the new input \(x = 5\) that curve answers 4, lower than the label at \(x = 4\), while the line \({1.4x + 0.5}\) answers 7.5. A perfect fit to the examples is not the goal. Good answers for new inputs are. Module ML01.8 is about that tension.
Check yourself
Recall
1. In one sentence, what is a model?
Show answer
A family of functions of one fixed form, with parameters that pick out one member.
2. Name the parameters of the threshold family and of the line family.
Show answer
The threshold family has one, the cut \(c\). The line family has two, the slope \(w\) and the intercept \(b\).
3. What does turning a knob change: the input, the form of the function, or the member in use?
Show answer
The member in use. The form is fixed by the model, and the input comes from the example.
4. Why can the best line never fit worse than the best flat line?
Show answer
Every flat line is a line with \(w = 0\). So the best flat line is itself one of the lines, and the best line is at least as good as it.
5. How many examples fix both knobs of a line, and what must be true of them?
Show answer
Two, with different inputs. Then \({w = (y_2 - y_1)/(x_2 - x_1)}\) and \({b = y_1 - w x_1}\).
Exercises
1.★ (a) Give the answers of the threshold rule with \(c = 3.5\) for the inputs \(1, 3, 4, 8\). (b) For the line with \(w = 0.5\) and \(b = 2\), find the answers and the misses on the four points.
Show solution
(a) Only 4 and 8 are above 3.5, so the answers are \(0, 0, 1, 1\).
(b) The answers are \({0.5 \cdot 1 + 2 = 2.5}\), then \(3\), \(3.5\) and \(4\). The misses are \({2.5 - 2 = 0.5}\), \({3 - 3 = 0}\), \({3.5 - 5 = -1.5}\) and \({4 - 6 = -2}\). The largest miss is 2.
2.★★ Find the line through the two middle points, \((2, 3)\) and \((3, 5)\). What does it answer at \(x = 1\) and at \(x = 4\), and by how much does it miss there?
At \(x = 1\) it answers \(1\), a miss of \({1 - 2 = -1}\). At \(x = 4\) it answers \(7\), a miss of \({7 - 6 = +1}\). It hits the middle exactly and misses both ends by 1. Compare the worked example, which hit the ends and missed the middle by a third.
3.★★★ Take the family “comfortable when \({a < x < b}\)” and the eight temperatures \(14, 16, \dots, 28\). (a) How many different sets of answers can this family give on them? (b) How many can the one-cut family “comfortable when \(x > c\)” give? (c) Does either family contain the other, as far as these eight rooms can tell?
Show solution
(a) The rooms answered “comfortable” are those strictly between \(a\) and \(b\). On a number line that is always a run of neighbouring rooms, or no room at all. Count the runs by length: 8 runs of one room, 7 of two, and so on down to 1 run of all eight. That is
(b) The rooms above a cut are the warmest \(k\) rooms, for \(k = 0, 1, \dots, 8\). That is 9 sets.
(c) Each of those 9 sets is either empty or a run that ends at the warmest room, so it is among the 37: take \(a = c\) and any \(b\) above 28. On these rooms the two-cut family can do everything the one-cut family can, and 28 things more. Neither comes close to the \(2^8 = 256\) sets that are possible in principle.
Summary card
A model is a family of functions. Its parameters pick one member.
ML01.1.3-F1
One shape, many settings.
Model.\({\hat{y} = f(x; \theta)}\), with the form of \(f\) fixed and the parameters \(\theta\) free.
Threshold family.\({\hat{y} = 1}\) if \(x > c\), else \(0\). One parameter, \(c\).
Line family.\({\hat{y} = wx + b}\). Two parameters: slope \(w\) and intercept \(b\).
Two examples fix a line.\({w = (y_2 - y_1)/(x_2 - x_1)}\) and \({b = y_1 - w x_1}\).
Too simple. If no member fits, tuning cannot help. Change the family.
Sources and next steps
Sources. Each was opened and checked against this lesson on 12 November 2026.
Simon J. D. Prince, Understanding Deep Learning, MIT Press, 2023 (free PDF, dated 8 February 2026). Section 2.1 says a model “represents a family of different relations between the input and the output” and that the choice of parameters determines the particular relation. Section 2.2.1 and Figure 2.1 apply this to the line: the parameters determine the member of the family.
Tengyu Ma and Andrew Ng, CS229 Lecture Notes, Stanford University. Chapter 1 (page 9) introduces the parameters, also called weights, as “parameterizing the space of linear functions”, after noting that we must decide how to represent the functions a learner may choose from.
Marc Peter Deisenroth, A. Aldo Faisal and Cheng Soon Ong, Mathematics for Machine Learning, Cambridge University Press, 2020 (free PDF). Section 8.1.2 defines a predictor as a function from features to an output. Section 8.2.1 asks what set of functions the predictor may come from, and writes it as \(f(\cdot, \theta)\) with parameters \(\theta\), the letter used here.
scikit-learn, LinearRegression and DummyRegressor. The first documents coef_ and intercept_. The second, with strategy="mean", always predicts the mean of the training targets and stores it in constant_.