NaN is a float that is not equal to itself: see how it spreads through NumPy and how pandas skips it, count it with isna, answer it with dropna, fillna or ffill, and find the rows that two overlapping files repeat with duplicated and drop_duplicates.
P02.5.2L1 Core25 minIn review (what this means)
The maths and code on this page are checked by automated tests on every change, but an independent reader has not signed it off yet. Spot a mistake or a confusing step? Tell us.
State three facts about NaN: it is a float, it is not equal to itself, and it spreads through NumPy arithmetic while pandas reductions skip it.
Count missing values with isna().sum(), and apply dropna (with subset), fillna and ffill by hand and with pandas.
Work out what each response does to the count, the mean and the standard deviation of a column.
Find and remove the rows that stacking two files with pd.concat repeats, using duplicated and drop_duplicates(subset=…).
The question
The coast logger missed Tuesday, so its column reads 21, NaN, 27, 29. NumPy says the mean is nan, pandas says 25.67. Which is right, what should go in the gap, and what happens when the same Tuesday readings arrive twice from two files?
From the last lesson
1. A column holds 21, 19, 27 C and 26. What dtype does read_csv give it?
Show answer
str: one entry is not a number, so the whole column stays text.
2. What does pd.to_numeric(col, errors="coerce") do with an entry it cannot read?
Show answer
It writes NaN there without a warning, which is why you count the missing values before and after.
Intuition
A missing value is a hole in a table: a reading that should be there and is not. pandas marks a hole in a number column with NaN, “not a number”, the special float that P02.1.4 met. A hole cannot be computed with, so sooner or later you choose one of three responses.
P02.5.2-F1
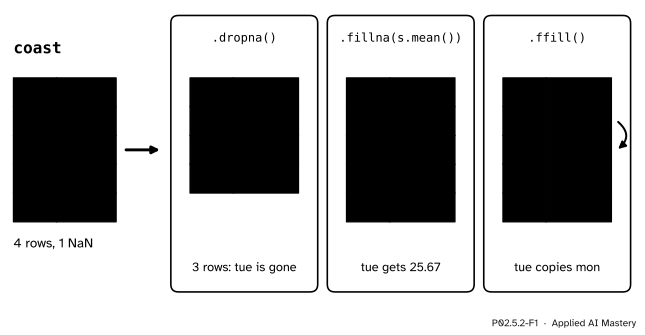
Three responses to one hole. Drop the row, fill it with a number such as the mean, or carry the last reading forward.
Drop the row. Honest about what you know, but the table gets shorter: here by a quarter.
Fill the hole with a number. The table keeps its shape, but the number is a guess, and a guess of 0 °C is a bad one.
Carry forward the last reading. Natural for readings in time order, and a guess too.
Before any of them, you count. Many models in scikit-learn refuse input that holds NaN, and a dataset that silently lost a quarter of its rows trains a weaker model, so the count of holes is the first number to know about any table. Which response is honest depends on why the value is missing, the subject of S01.6; this lesson is about doing each one correctly.
Build it up
Step 1. NaN is a float.type(np.nan) is float. That is why an integer column with one hole becomes float64 (the second panel of P02.5.1’s second figure).
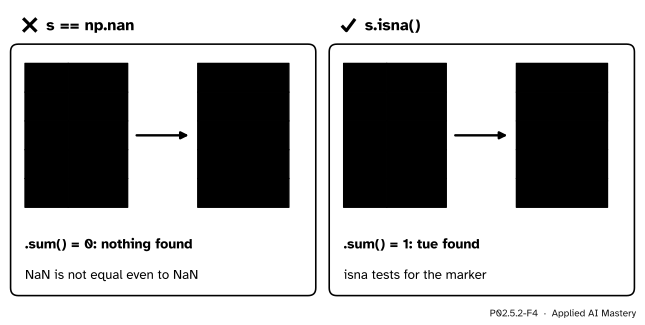
Step 2. NaN is not equal to itself.np.nan == np.nan is False, by a rule of the IEEE 754 floating-point standard, which Python and NumPy follow. So a test with == can never find a hole. The tests that can are math.isnan(x) for one number and s.isna() for a whole Series.
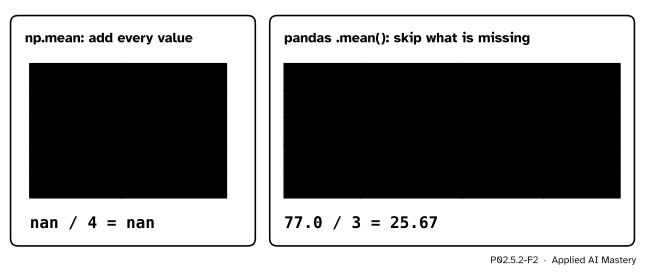
Step 3. NaN spreads in NumPy and is skipped in pandas. Any sum that includes a NaN is NaN. np.mean adds every value, so one hole spoils the mean. pandas reductions such as .mean(), .sum() and .std() skip missing values by default and count only what is present.
P02.5.2-F2
The same four values, two loops. Once NaN enters a sum, the sum stays NaN. Skipping the hole also means not counting it: 77 is divided by 3, not by 4.
Step 4. Count the holes.df.isna() gives a table of True and False of the same shape, and .sum() adds each column, since True counts as 1 (P02.3.2).
Step 5. Respond.dropna, fillna and ffill, each shown in the anchor figure.
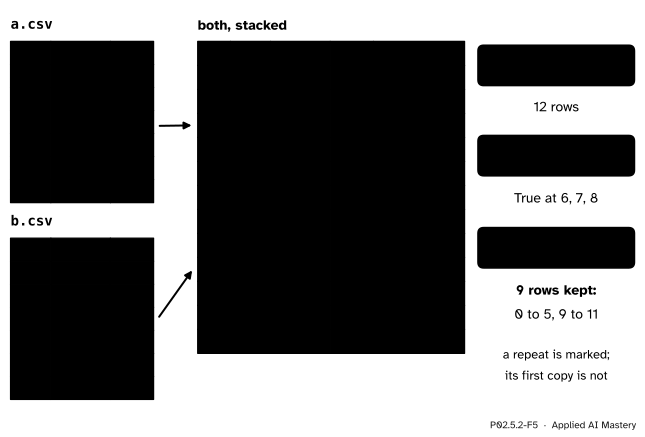
Step 6. Duplicates. A second kind of dirt is a row that appears twice, often because two files cover the same days. pd.concat([a, b]) stacks two tables one under the other, and duplicated() marks every row that has appeared before.
P02.5.2-F5
Two logger files that overlap on Tuesday. Stacked, the three Tuesday rows appear twice; duplicated marks the second copies and drop_duplicates removes them.
The formal statement
NoteMissing values in pandas
s.isna() is True exactly where s holds a missing value; df.isna().sum() counts them per column. Reductions (sum, mean, std, …) skip missing values unless skipna=False.
df.dropna() removes every row with a missing value in any column; df.dropna(subset=["temp"]) looks only at the columns named.
s.fillna(v) puts v in every hole; s.ffill() puts in each hole the last value above it that is present (a hole in the first row has nothing above it and stays empty).
df.duplicated() is True for a row whose values, in every column, equal those of an earlier row; subset=[...] compares only the columns named. df.drop_duplicates() keeps the rows where duplicated() is False.
Why the mean fill keeps the mean. Let the \(n\) values that are present have mean \(m\), so they add up to \(nm\). Fill \(k\) holes with \(m\). The new mean is
Why it shrinks the spread. The standard deviation that pandas computes divides the sum of squared deviations from the mean by the count less one (P02.4.1). Each filled value sits exactly at the mean, so it adds \(0\) to the sum of squares \(S\), while the count grows from \(n\) to \(n + k\):
With 3 values the standard deviation is \(\sqrt{34.67 / 2} = 4.16\). With the mean filled in, \(S\) is unchanged and there are 4 values: \(\sqrt{34.67 / 3} = 3.40\).
P02.5.2-F3
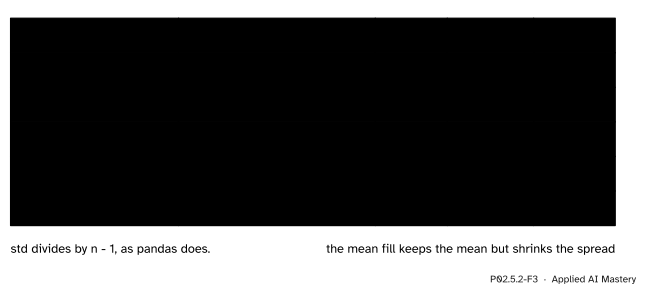
What each response does. Dropping changes nothing but the count; filling with 0 drags the mean; filling with the mean keeps the mean but shrinks the spread from 4.16 to 3.40.
Code
The three facts about NaN, and the skipping mean written by hand.
import mathimport numpy as npimport pandas as pdprint(type(np.nan), np.nan == np.nan, math.isnan(np.nan))values = [21, np.nan, 27, 29]print("np.mean:", np.mean(values))total, count =0, 0for v in values:if math.isnan(v):continue# skip the hole, and do not count it total += v count +=1print("skipping by hand:", total, count, total / count)coast = pd.Series(values, index=["mon", "tue", "wed", "thu"], name="coast")print("pandas:", coast.mean(), coast.count(), coast.size)
<class 'float'> False True
np.mean: nan
skipping by hand: 77 3 25.666666666666668
pandas: 25.666666666666668 3 4
The three responses by hand on a plain list, then in pandas.
dropped = [v for v in values ifnot math.isnan(v)]mean =sum(dropped) /len(dropped)filled = [mean if math.isnan(v) else v for v in values]carried, last = [], math.nanfor v in values:ifnot math.isnan(v): last = v carried.append(last)print(dropped, [round(v, 2) for v in filled], carried)print(coast.dropna().tolist())print(coast.fillna(coast.mean()).round(2).tolist())print(coast.ffill().tolist())
The same check by hand: a set of the rows seen so far (P01.6.3).
seen, repeats =set(), []for i, row inenumerate(both.itertuples(index=False)): key =tuple(row)if key in seen: repeats.append(i) seen.add(key)print(repeats)
[6, 7, 8]
Explore
This module’s interactive, the join matcher, lives in P02.5.4. There you will see NaN appear again: it is what a join writes in a row whose key has no partner.
Pitfalls
P02.5.2-F4
Wrong beside right. A comparison with np.nan is False everywhere, even at the hole. isna finds it.
“s == np.nan finds the missing values.”
It finds none, because NaN is not equal to anything, itself included. Use s.isna(), or math.isnan(x) for a single number.
“fillna(0) is a harmless placeholder.”
A zero in a temperature column is a claim that it was 0 °C. The mean fell from 25.67 to 19.25 and the standard deviation more than tripled. Fill only with a value you can defend, and say which.
“dropna() drops the rows where my column is missing.”
It drops a row if any column is missing. On the table week it kept 2 rows, not 3, because Wednesday had no sky. Name the columns that matter with subset.
“duplicated() found nothing, so nothing is repeated.”
If each row also carries the name of its file, or the time it was loaded, no two rows are equal in every column. Compare only the columns that identify a reading: duplicated(subset=["day", "station"]). Repeats matter in machine learning: a row that lands in both the training and the test set makes the test score look better than it is.
Check yourself
Recall
1. What is np.nan == np.nan, and how do you test whether x is NaN?
Show answer
False. Use math.isnan(x), or s.isna() for a Series.
2. What are the mean of 21, NaN, 27, 29 in NumPy (np.mean) and in pandas (.mean())?
Show answer
nan in NumPy, since the hole spreads through the sum; 25.67 in pandas, which skips it and divides 77 by 3.
3. What does ffill put in Tuesday’s place in the coast column?
Show answer
21.0, the last value above it that is present (Monday’s).
4. How do df.dropna() and df.dropna(subset=["temp"]) differ?
Show answer
The first drops a row with a missing value in any column; the second looks only at temp.
5. Two files of 6 rows overlap on three rows. How many rows does pd.concat give, and how many does drop_duplicates keep?
Show answer
12 rows after stacking, 9 after removing the three repeats.
Exercises
1.★ The hill logger reads 19, NaN, NaN, 20 for Monday to Thursday. Give the result of dropna, of fillna with the mean, and of ffill.
Show solution
dropna keeps Monday 19 and Thursday 20. The mean of the present values is \((19 + 20)/2 = 19.5\), so fillna gives 19, 19.5, 19.5, 20. ffill carries Monday’s 19 into both holes: 19, 19, 19, 20.
2.★★ A column has \(n\) present values with standard deviation \(s\) (dividing by \(n - 1\)), and \(k\) holes. Show that after filling the holes with the mean the standard deviation is \(s\sqrt{(n - 1)/(n + k - 1)}\), and check it on the coast column.
Show solution
The filled values sit at the mean, so the sum of squared deviations \(S\) does not change, and \(S = (n - 1)s^2\). After filling there are \(n + k\) values, so the new standard deviation is
\[
\begin{aligned}
\sqrt{\frac{S}{n + k - 1}}
&= \sqrt{\frac{(n - 1)s^2}{n + k - 1}} \\
&= s\sqrt{\frac{n - 1}{n + k - 1}} .
\end{aligned}
\]
For the coast column \(n = 3\), \(k = 1\), \(s = 4.16\): \(4.16 \cdot \sqrt{2/3} = 3.40\), as in the table.
3.★★★ Each row of the two logger files now carries its file name: pd.concat([a.assign(file="a.csv"), b.assign(file="b.csv")], ignore_index=True). How many rows does duplicated() mark, and why? What should you write instead, how many rows are kept, and which copy of Tuesday survives with keep="last"?
Show solution
None: the Tuesday rows from a and from b differ in the file column, so no row equals an earlier one in every column. Compare the columns that identify a reading: duplicated(subset=["day", "station"]) marks rows 6, 7 and 8, and drop_duplicates(subset=["day", "station"]) keeps the other 9 rows. With keep="last" the later copies are kept instead, so Tuesday’s rows come from b.csv (index 6, 7, 8) and rows 3, 4 and 5 are dropped.
Summary card
Count the holes, then drop, fill or carry forward, and know what each one costs.
P02.5.2-F1
Three responses to one hole.
NaN is a float, NaN != NaN, and it spreads through NumPy sums; pandas reductions skip it.
Count with df.isna().sum(); test with isna, never with == np.nan.
dropna(subset=...), fillna(value), ffill(). A mean fill keeps the mean and shrinks the spread.
pd.concat([a, b]) stacks; duplicated(subset=...) marks repeats; drop_duplicates removes them.
Sources and next steps
Sources. Each was opened and checked against this lesson on 15 November 2026.
The pandas development team, Working with missing data, pandas 3.1.1 User Guide: np.nan == np.nan is False and missing values are tested with isna; pandas reductions such as std skip missing values by default while numpy.std returns nan, and skipna=False includes them; dropna, fillna and ffill.
The pandas development team, pandas.DataFrame.duplicated, pandas 3.1.1 API reference: subset limits the comparison to some columns, and keep="first" marks every copy except the first.
Python Software Foundation, math: Mathematical functions, entries math.nan and math.isnan: by the IEEE 754 standard a NaN is not equal to any value, itself included, so it is tested with isnan, not with == or is.