sum, mean, min, max and argmax collapse a table along one axis: the axis you name is the one that disappears. Compute the station and day means of four days of temperatures by loops and by NumPy, and keep the collapsed axis with keepdims.
P02.2.2L1 Core25 minIn review (what this means)
The maths and code on this page are checked by automated tests on every change, but an independent reader has not signed it off yet. Spot a mistake or a confusing step? Tell us.
Predict the shape of a reduction: the named axis disappears, or stays with size 1 under keepdims=True.
Compute the column means and row means of a 2-D array with nested loops, then with mean(axis=0) and mean(axis=1).
Use argmax along an axis to find the position of the largest entry in each column, and max to find its value.
Show that summing the column sums and summing the row sums both give the total of the table.
The question
Four days of noon temperatures at three weather stations sit in one table. Which station is warmest on average, and which day was warmest? Both questions ask for a mean of the same twelve numbers, yet they need different answers: three numbers in one case, four in the other. How do you tell NumPy which one you mean?
From the last lesson
1. With x = np.array([1, 2, 3, 4]), what is x * 1.4 + 0.5?
Show answer
[1.9, 3.3, 4.7, 6.1]: every entry is multiplied by 1.4 and then 0.5 is added.
2. What is the difference between x * x and x @ x?
Show answer
x * x multiplies entry by entry, [1, 4, 9, 16]; x @ x multiplies and adds, the dot product 30.
Intuition
The course’s running table is temps: noon temperatures in degrees Celsius at three stations (coast, hill, valley) on four days, Monday 3 to Thursday 6 March 2025. The numbers are invented for teaching. Rows are days and columns are stations, so the shape is (4, 3): axis 0 runs down the days and axis 1 runs across the stations (P02.1.2).
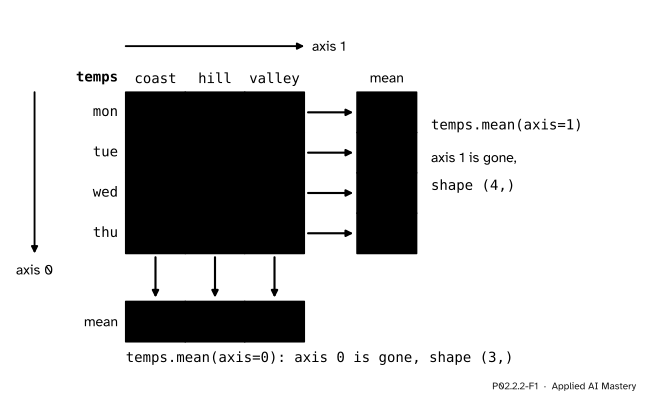
A reduction turns many numbers into one: a sum, a mean, a smallest or largest value. On a table you choose the direction. Squash the table down axis 0 and each column becomes one number; squash it across axis 1 and each row becomes one number.
P02.2.2-F1
The same table reduced two ways. mean(axis=0) collapses the days and leaves one mean per station; mean(axis=1) collapses the stations and leaves one mean per day.
The rule to remember: the axis you name is the one that disappears. Naming axis 0 gets rid of the four days, so three numbers remain, one per station. Naming axis 1 gets rid of the three stations, so four numbers remain, one per day.
Build it up
Step 1. No axis: one number.temps.sum() adds all twelve entries and gives 300. temps.mean() divides by 12 and gives 25, the overall mean.
Step 2. Down axis 0.temps.sum(axis=0) adds down each column: coast \({21 + 27 + 27 + 29 = 104}\), hill \({19 + 23 + 18 + 20 = 80}\) and valley \({26 + 28 + 30 + 32 = 116}\). Dividing by the 4 days gives the station means [26, 20, 29], which is temps.mean(axis=0).
Step 3. Across axis 1.temps.sum(axis=1) adds along each row: Monday \({21 + 19 + 26 = 66}\), then 78, 75 and 81. Dividing by the 3 stations gives the day means [22, 26, 25, 27], which is temps.mean(axis=1).
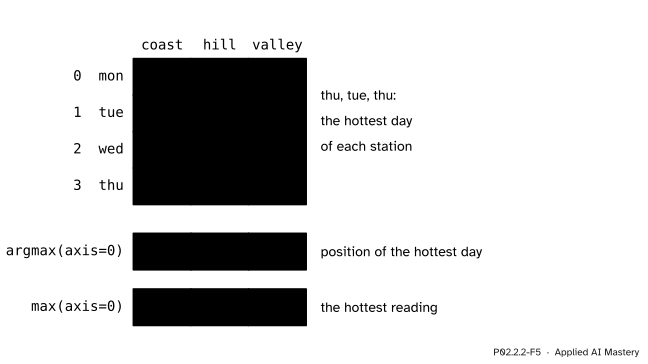
Step 4. Largest, smallest and where.max, min and argmax take an axis too. max(axis=0) gives each station’s hottest reading, [29, 23, 32]. argmax(axis=0) gives the position of that reading along axis 0, which is the day: [3, 1, 3], meaning Thursday, Tuesday and Thursday.
P02.2.2-F5
argmax(axis=0) returns where each column’s largest entry sits; max(axis=0) returns the entry.
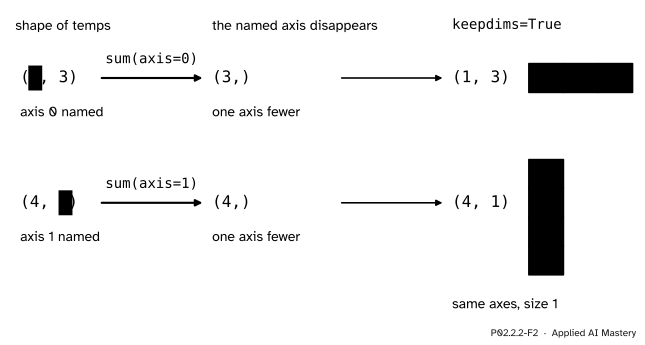
Step 5. Keeping the axis. A reduction normally drops the axis, so temps.mean(axis=1) has shape (4,). With keepdims=True the axis stays, with size 1: temps.mean(axis=1, keepdims=True) has shape (4, 1), a column with one mean per day. It holds the same four numbers. The next two lessons show why the column shape matters: it lines up with temps for subtraction, where the flat (4,) does not.
P02.2.2-F2
A reduction removes the size of the named axis from the shape. With keepdims=True that size becomes 1 instead, so the result keeps as many axes as the table.
The formal statement
NoteDefinition: a reduction along an axis
Let \(\mat{A}\) be an array of shape \((m, n)\) with entries \(a_{ij}\). The sums along the two axes are
\[
\begin{aligned}
s_j &= \sum_{i=1}^{m} a_{ij}, \quad j = 1, \dots, n, \\
r_i &= \sum_{j=1}^{n} a_{ij}, \quad i = 1, \dots, m .
\end{aligned}
\]
The column sums \(s_j\) come from collapsing axis 0 and form an array of shape \((n,)\); the row sums \(r_i\) come from collapsing axis 1 and have shape \((m,)\). The mean along an axis divides by the length of that axis: \(s_j / m\) and \(r_i / n\). max, min and argmax replace the sum by the largest value, the smallest value and the position of the largest value. With keepdims=True the shapes are \((1, n)\) and \((m, 1)\).
In general, for an array of any number of axes, a reduction along axis \(k\) returns an array whose shape is the original shape with entry \(k\) removed (or set to 1 under keepdims=True). In code the positions count from 0, so s[0] is the coast sum.
Fact 1: both routes reach the same total. Adding the column sums adds every entry once:
So the mean of [26, 20, 29] is \({75 / 3 = 25}\), the overall mean, and so is the mean of [22, 26, 25, 27], which is \({100 / 4 = 25}\). This works because every column has the same number of entries. When groups have different sizes, as in the group-by of P02.6, a mean of means is no longer the overall mean.
Ties. When a column’s largest value appears twice, argmax returns the first position, as the NumPy reference states. Without an axis, argmax returns a position in the flattened array.
Worked example
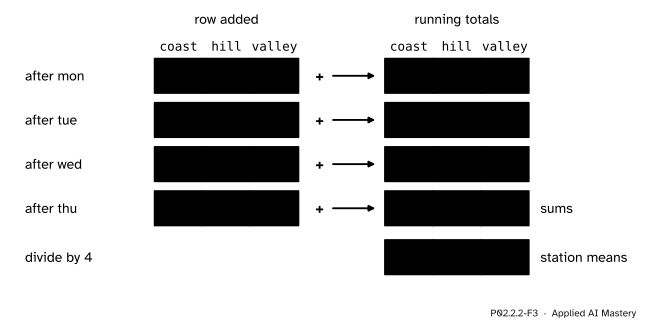
Station means by hand, the way a loop computes them. Keep three running totals, one per station, starting at 0. Visit the days in order and add each day’s row to the totals.
P02.2.2-F3
The worked example as a trace. Each step adds one day’s row to the running totals; dividing the final totals by 4 gives the station means.
After Monday the totals are \((21, 19, 26)\). After Tuesday, \({(21 + 27,\ 19 + 23,\ 26 + 28)} = {(48, 42, 54)}\). After Wednesday, \((75, 60, 84)\). After Thursday, \((104, 80, 116)\). Dividing each total by the 4 days gives \((26, 20, 29)\): the valley is warmest on average and the hill coolest.
For the day means, run the loop the other way: for each day, add its three readings and divide by 3. Monday gives \({66 / 3 = 22}\), Tuesday \({78 / 3 = 26}\), Wednesday \({75 / 3 = 25}\) and Thursday \({81 / 3 = 27}\). Thursday was the warmest day.
Code
First the loops. The outer loop runs over what survives; the inner loop runs over the axis being collapsed.
import numpy as nptemps = np.array([[21, 19, 26], [27, 23, 28], [27, 18, 30], [29, 20, 32]])n_days, n_stations = temps.shapestation_means = []for j inrange(n_stations): # what survives: the stations total =0for i inrange(n_days): # what collapses: the days, axis 0 total = total + temps[i, j] station_means.append(total / n_days)day_means = []for i inrange(n_days): # what survives: the days total =0for j inrange(n_stations): # what collapses: the stations, axis 1 total = total + temps[i, j] day_means.append(total / n_stations)print(station_means, day_means)
The same pattern runs through machine learning. A batch of scores for 4 examples and 3 classes has shape (4, 3), like temps. The loss is averaged over the examples, along axis 0, and each example’s predicted class is scores.argmax(axis=1), the position of its largest score:
The last example has a tie between classes 0 and 1, and argmax returns the first, 0.
Explore
The module’s interactive, the broadcast stretcher, is in lesson P02.2.3. Pick the presets (4, 1) and (1, 3) there: those are exactly the shapes that keepdims=True gives for the day means and the station means.
Pitfalls
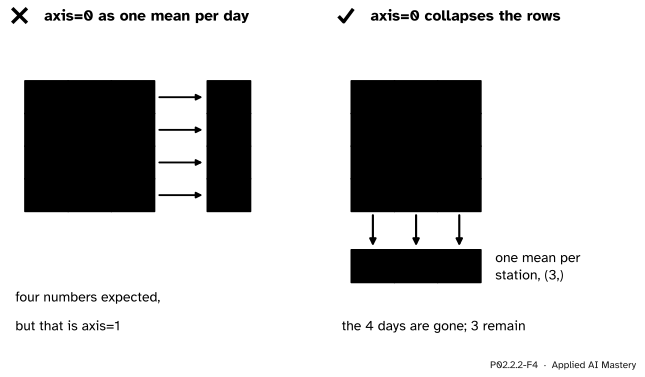
P02.2.2-F4
Wrong beside right. axis=0 does not mean “one answer per row”. It names the axis that is collapsed, the days, so one answer per station is left.
“axis=0 means one result per row.”
It means the opposite: axis 0, the rows, is the one that disappears, and one result per column remains. VanderPlas puts it this way: the axis keyword names the dimension that will be collapsed, not the one that will be returned. To check, read the shape: temps is (4, 3), so a result of length 3 came from collapsing the 4.
“argmax gives the largest value.”
It gives the position of the largest value. temps.argmax(axis=0) is [3, 1, 3], the days of the hottest readings, while temps.max(axis=0) is [29, 23, 32], the readings. With ties it gives the first position.
“temps.mean() gives the station means.”
With no axis, a reduction runs over every entry and returns one number, here 25. Name the axis whenever you want one result per row or per column.
“keepdims changes the numbers.”
It changes only the shape. temps.mean(axis=1) and temps.mean(axis=1, keepdims=True) hold the same four day means, as (4,) and as (4, 1). Lesson P02.2.4 shows why the second shape is the one to subtract from temps.
Check yourself
Recall
1.temps has shape (4, 3). What are the shapes of temps.sum(axis=0) and temps.sum(axis=1)?
Show answer
(3,) and (4,). The named axis disappears.
2. What are the station means and the day means of temps?
Show answer
Station means temps.mean(axis=0) are [26, 20, 29]; day means temps.mean(axis=1) are [22, 26, 25, 27].
3. What does temps.argmax(axis=0) return, and what does each number mean?
Show answer
[3, 1, 3]: the position along axis 0 (the day) of each station’s hottest reading, so Thursday for the coast, Tuesday for the hill and Thursday for the valley.
4. What does keepdims=True do to the shape of temps.mean(axis=1)?
Show answer
It keeps the collapsed axis with size 1, so the shape is (4, 1) instead of (4,). The values are the same.
5. Why is the mean of the three station means equal to the overall mean 25?
Show answer
Every station has the same number of readings, 4. Then the mean of the column means is the sum of all twelve entries divided by 12.
Exercises
1.★ Compute temps.min(axis=1) and temps.argmin(axis=1) by hand and say what they mean.
Show solution
Each row’s smallest reading: Monday \(\min(21, 19, 26) = 19\), Tuesday \(23\), Wednesday \(18\), Thursday \(20\), so min(axis=1) is [19, 23, 18, 20]. Each of these sits in column 1, so argmin(axis=1) is [1, 1, 1, 1]: the hill was the coolest station on every day.
2.★★ The range of a column is its largest value minus its smallest. Write one NumPy expression for the range of each station and compute it.
Show solution
temps.max(axis=0) - temps.min(axis=0). The maxima are [29, 23, 32] and the minima [21, 18, 26], so the ranges are [8, 5, 6]. Both reductions have shape (3,), so they subtract entry by entry, as in P02.2.1. (NumPy also has np.ptp, “peak to peak”, for this.)
3.★★★ An array w has shape (5, 4, 3). Give the shapes of w.sum(axis=1), w.sum(axis=(0, 2)) and w.sum(axis=1, keepdims=True), and explain why w.sum(axis=0).sum() equals w.sum().
Show solution
w.sum(axis=1) removes the 4: shape (5, 3). w.sum(axis=(0, 2)) removes the 5 and the 3: shape (4,). w.sum(axis=1, keepdims=True) keeps that axis with size 1: shape (5, 1, 3). Finally w.sum(axis=0) is a (4, 3) array whose entries are sums over the first index; adding all its entries adds every entry of w exactly once, the same reordering of a finite sum as in Fact 1.
Summary card
The axis you name is the axis that disappears.
P02.2.2-F1
One table, two directions to collapse.
temps.mean(axis=0) is [26, 20, 29], shape (3,); temps.mean(axis=1) is [22, 26, 25, 27], shape (4,).
keepdims=True keeps the axis with size 1: (1, 3) or (4, 1).
Column sums and row sums both add up to the total, 300.
Sources and next steps
Sources. Each was opened and checked against this lesson on 15 November 2026.
NumPy developers, numpy.mean, NumPy reference, version 2.5. The axis parameter (the default is the mean of the flattened array) and keepdims: the reduced axes are left in the result as dimensions with size one, so that the result broadcasts correctly against the input.
NumPy developers, numpy.argmax, NumPy reference, version 2.5. Notes: with several occurrences of the maximum, the index of the first is returned; by default the index is into the flattened array.
NumPy developers, Universal functions (ufunc) basics, NumPy user guide, version 2.5. Reductions take an axis keyword that names the axis over which the reduction takes place.
Jake VanderPlas, Aggregations: Min, Max, and Everything In Between, Python Data Science Handbook. Section “Multi dimensional aggregates”: the axis keyword specifies the dimension of the array that will be collapsed, rather than the one that will be returned.
Next.P02.2.3 The broadcasting rule explains when arrays of different shapes, such as temps and its station means, can meet in one expression.