def f(x):
    # double, then add 3
    return 2 * x + 3

print(f(1), f(0), f(-2))
5 3 -1Before this lesson
M01.1 Numbers, algebra and notation M01.2 Coordinates and a first look at vectors
After this lesson you can
In review. The maths and code on this page are checked by automated tests on every change, but an independent reader has not signed it off yet. Spot a mistake or a confusing step? Tell us.
Type 3 into a calculator and press the square key: it shows 9, every time. Now ask a friend “which number squares to 9?” and you get two good answers, 3 and −3. One of these rules is a function and the other is not. What exactly is the difference, and why must every model in machine learning be on the right side of it?
Picture a machine with a slot on one side and a chute on the other. You drop a number in, the machine does something to it, and a number comes out. The machine below doubles what it is given, then adds 3. Drop in 1 and out comes 5.
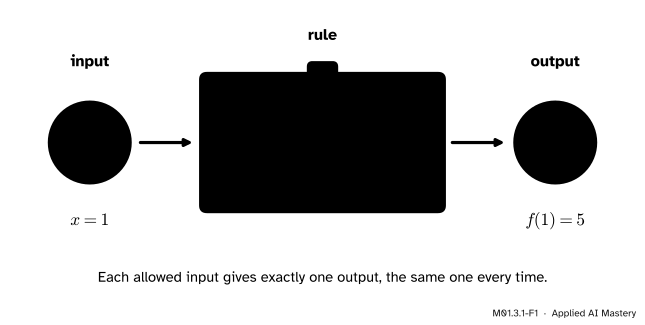
A function machine: an input goes in, the rule acts on it, an output comes out.
The number that goes in is the input, the number that comes out is the output, and the rule in the middle is the function. What makes it a function is a promise: every number you are allowed to drop in gives an output, exactly one, and the same one every time.
Machine learning is built on that promise. A model takes an input, such as the floor area of a flat or the pixels of a photo, and returns one prediction. The course’s line \({\hat{y} = 1.4x + 0.5}\) is such a machine: put in \({x = 3}\) and out comes \({4.7}\), every time.
Step 1. Give the machine a name. We call it \({f}\) and write \({f(x)}\) for the output when the input is \({x}\). Read it “f of x”. The machine above is
\[ f(x) = 2x + 3 . \]
To use it, replace \({x}\) by the input: \({f(1) = 2 \times 1 + 3 = 5}\), then \({f(0) = 2 \times 0 + 3 = 3}\), and \({f(-2) = 2 \times (-2) + 3} = {-1}\). The brackets in \({f(1)}\) do not mean “times”. They name the input.
Step 2. Say what may go in. The set of allowed inputs is the domain. Any number can be doubled and increased by 3, so the domain of \({f}\) is every real number, \({\R}\). Other machines are pickier. “Divide 12 by the number” cannot take 0, because nothing times 0 makes 12. “Take the square root” accepts only numbers that are 0 or more, because no number squares to a negative one.
Step 3. Say what comes out. The set of outputs actually produced is the range. Every number \({y}\) comes out of \({f}\): the input \({(y - 3)/2}\) gives \({2 \times \tfrac{y-3}{2} + 3 = y}\). So the range of \({f}\) is all of \({\R}\) too. The shorthand
\[ f : \R \to \R \]
says “\({f}\) takes real numbers in and gives real numbers out”. In general \({f : A \to B}\) says that inputs come from the set \({A}\) and outputs land in the set \({B}\). The range is the part of \({B}\) really reached, and the worked example shows it can be smaller than \({B}\).
Step 4. One function, four ways. The same machine can be written in words, as a formula, as a table of inputs and outputs, and as a graph.
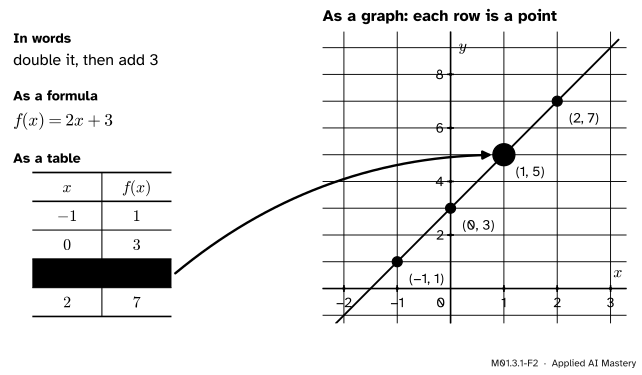
One function, four ways. Each row of the table becomes a point of the graph.
The graph is the table drawn on the coordinate plane of lesson M01.2.1. Each row \({(x, f(x))}\) becomes a point: across by the input, then up by the output. Add inputs halfway between, such as \({f(0.5) = 4}\) and \({f(1.5) = 6}\), and the gaps fill in. With every input drawn, the points make one unbroken straight line: the graph of \({f}\).
Step 5. Read an output off the graph. To find \({f(a)}\) from the graph, start at \({a}\) on the \({x}\)-axis, go straight up or down to the graph, and read the height. “Straight up and down” is the vertical line through \({a}\). A function has exactly one output at \({a}\), so that line meets its graph exactly once. That gives a test that needs no formula at all.
Why, one way round. Suppose the vertical line \({x = a}\) met the graph of a function \({f}\) twice, at \({(a, y_1)}\) and \({(a, y_2)}\) with \({y_1 \neq y_2}\). Every point of the graph above \({a}\) has height \({f(a)}\), so both heights would be outputs at the one input \({a}\). A function gives only one. So the graph of a function never meets a vertical line twice.
Why, the other way round. Suppose no vertical line meets a curve more than once. For each \({a}\) whose vertical line does meet it, call the height of the meeting point \({f(a)}\). Each such \({a}\) then has exactly one output, so \({f}\) is a function, its domain is the set of those \({a}\), and the curve is its graph.
The classic curve that fails is a circle. The circle of radius 5 around the origin is the set of points at distance 5 from \({(0, 0)}\), so by the distance formula of lesson M01.2.3 its equation is
\[ x^2 + y^2 = 25 . \]
The line \({x = 3}\) meets it where \({9 + y^2 = 25}\), so \({y^2 = 16}\) and \({y = 4}\) or \({y = -4}\): at \({(3, 4)}\) and at \({(3, -4)}\), the 3-4-5 triangle of lesson M01.2.2 above and below the axis.
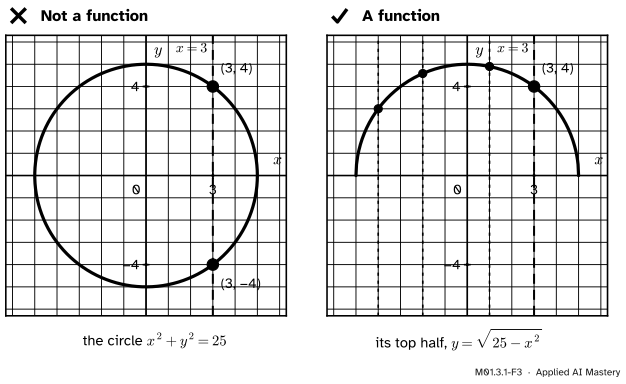
The vertical-line test. Left: the line \({x = 3}\) meets the circle twice, so the input 3 would have two outputs. Right: keep only the top half and every vertical line meets it at most once.
The top half alone passes. It is the graph of \({y = \sqrt{25 - x^2}}\), with domain \({-5}\) to \({5}\). The square-root sign always means the answer that is 0 or more, so the formula gives the upper point and never the lower one.
University texts often define a function as a set of ordered pairs \({(x, y)}\), with \({x}\) in \({A}\) and \({y}\) in \({B}\), in which every \({x}\) of \({A}\) appears in exactly one pair. The rule is then just a way of saying which pairs belong. So two formulas that give the same output for every input, such as \({2x + 3}\) and \({\tfrac{4x + 6}{2}}\), are the same function. A Python dictionary, met in the code below, is exactly such a set of pairs.
The squaring machine \({g(x) = x^2}\). Show it four ways, find its domain and range, and test it.
In words. Multiply the number by itself.
As a table. Work out the output for each whole number from \({-3}\) to \({3}\). A negative times a negative is positive, so \({(-3) \times (-3) = 9}\) and \({(-2) \times (-2) = 4}\).
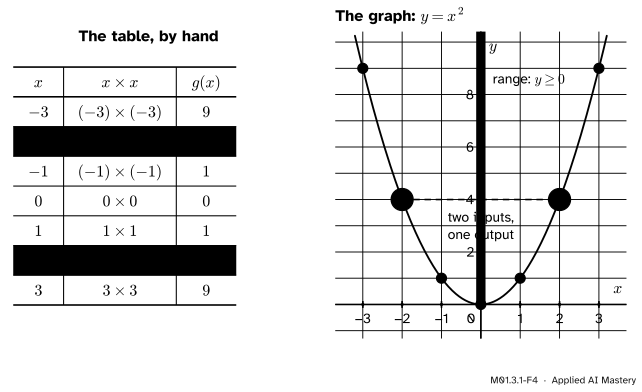
The squaring machine traced by hand. The rows for \({-2}\) and \({2}\) end at the same output, 4.
As a graph. The seven pairs are the points \({(-3, 9)}\), \({(-2, 4)}\), \({(-1, 1)}\), \({(0, 0)}\), \({(1, 1)}\), \({(2, 4)}\) and \({(3, 9)}\). Inputs between them fill in the curve: \({g(0.5) = 0.25}\) and \({g(1.5) = 2.25}\). The curve is the U-shaped parabola \({y = x^2}\), which lesson M01.3.3 studies.
Domain. Every real number can be multiplied by itself, so the domain is all of \({\R}\), and the squares are real numbers too: \({g : \R \to \R}\).
Range. First, no output is negative: a positive times a positive is positive, a negative times a negative is positive, and \({0 \times 0 = 0}\). Second, every \({y}\) that is 0 or more is reached, because the input \({\sqrt{y}}\) gives \({(\sqrt{y})^2 = y}\). So the range is all \({y \geq 0}\), only part of the \({\R}\) that outputs land in. On the graph, nothing lies below the \({x}\)-axis, and every height from 0 upwards is reached.
Is it a function? Yes. Each number has exactly one square. Two inputs share an output, \({g(-2) = g(2) = 4}\), and that is allowed: the rule asks for one output per input, not one input per output. Every vertical line meets the U exactly once.
First the machine from the intuition, as a Python function. def starts the definition, x is the input, and return hands back the output.
def f(x):
# double, then add 3
return 2 * x + 3
print(f(1), f(0), f(-2))5 3 -1A function can also be given by a table alone. Python’s dictionary is a ready-made table: each key is an input and its value is the output. Here are the course’s four data points.
# key: input, value: output
target = {1: 2, 2: 3, 3: 5, 4: 6}

# the output for the input 3
print(target[3])
# the domain, then the range
print(sorted(target.keys()))
print(sorted(set(target.values())))
5
[1, 2, 3, 4]
[2, 3, 5, 6]A dictionary holds one value for each key. Store a second value under a key already there and the first is forgotten, so a dictionary can hold a function but never a rule with two outputs.
# two pairs share the input 2
pairs = [(1, 2), (2, 3), (2, 4), (3, 5)]
lookup = {}
for x, y in pairs:
    # replaces the first value
    lookup[x] = y
print(lookup)
{1: 2, 2: 4, 3: 5}Finally, a whole table of points at once. numpy.linspace(-3, 3, 7) makes seven evenly spaced inputs from \({-3}\) to \({3}\), both ends included. One line squares them all, and the function f from the first cell works on the whole array too.
import numpy as np

xs = np.linspace(-3, 3, 7)
print(xs)
# both machines, every input
print(xs ** 2)
print(f(xs))

# the course's line, a machine
def predict(x):
    return 1.4 * x + 0.5

data = np.array([1, 2, 3, 4])
print(predict(data))
[-3. -2. -1. 0. 1. 2. 3.]
[9. 4. 1. 0. 1. 4. 9.]
[-3. -1. 1. 3. 5. 7. 9.]
[1.9 3.3 4.7 6.1]The last line is a machine-learning model at work: four inputs in, one prediction out for each. The CS229 lecture notes call such a function a hypothesis and draw it as a box with \({x}\) going in and a predicted \({y}\) coming out: a function machine.
Function machine
Choose a rule and slide the input, or drag the blue handle on the \({x}\)-axis. The number drops through the machine and lands on the graph as a point. Step feeds in the next input and Play feeds in all of them, so the curve builds up point by point.
Things to try:
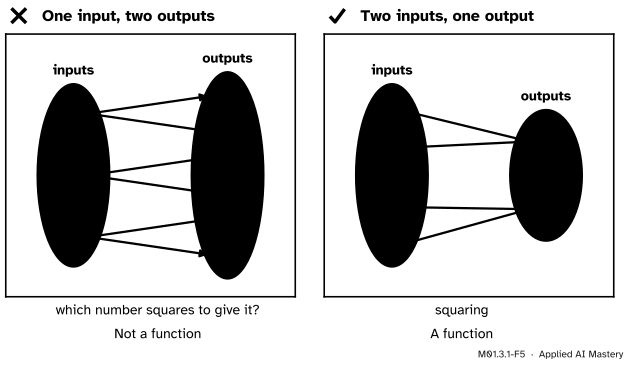
Wrong beside right. Left: “which number squares to give it?” sends each input to two outputs, so it is not a function. Right: squaring sends two inputs to one output, which is allowed.
“Two inputs with the same output break the rule.”
They do not. The rule is one output for each input, and squaring, which sends \({-3}\) and \({3}\) to the same 9, is a function. What breaks the rule is one input with two outputs, like the friend’s answer to “which number squares to 9?”. The square-root key avoids that by always giving the answer that is 0 or more, \({\sqrt{9} = 3}\), and that choice makes it a function.
“\({f(a + b)}\) is \({f(a) + f(b)}\).”
Usually not. With \({f(x) = 2x + 3}\), \({f(1 + 2) = f(3) = 9}\), but \({f(1) + f(2)} = {5 + 7} = {12}\). With squaring, \({g(1 + 2) = 9}\), but \({g(1) + g(2) = 5}\). Work out the input first, then put it through the machine. (Brackets after a function’s name never mean “times”: \({f(2)}\) is the output at 2.)
“A good model passes through every data point.”
Not if two examples share an input. Data can hold the pairs \({(2, 3)}\) and \({(2, 4)}\), which fail the vertical-line test. A model is a function, so it gives one prediction at \({x = 2}\) and must miss at least one of the two targets. Real data often hold such pairs, which is one reason no model is perfect.
1. What must be true of a rule for it to be a function?
Every allowed input gives exactly one output, the same one every time.
2. If \({f(x) = 2x + 3}\), what is \({f(4)}\), and how is it read aloud?
\({f(4) = 2 \times 4 + 3 = 11}\), read “f of 4 equals 11”.
3. What is the domain of “divide 12 by the number”, and why?
Every number except 0, because division by 0 has no answer.
4. A table sends the inputs 1, 2 and 3 to the outputs 5, 5 and 5. Is it a function? What is its range?
Yes: each input has exactly one output. The range is the single number 5.
5. Why is a circle not the graph of a function of \({x}\)?
Some vertical line meets it twice. The line \({x = 3}\) meets \({x^2 + y^2 = 25}\) at \({(3, 4)}\) and \({(3, -4)}\), so the input 3 would have two outputs.
1. ★ For \({h(x) = 3 - x}\), make a table for \({x = -1, 0, 1, 2, 3}\), plot the points, and give the domain and the range.
The outputs are \({h(-1) = 4}\), \({h(0) = 3}\), \({h(1) = 2}\), \({h(2) = 1}\) and \({h(3) = 0}\). The points \({(-1, 4)}\), \({(0, 3)}\), \({(1, 2)}\), \({(2, 1)}\) and \({(3, 0)}\) lie on a straight line that falls one step for each step to the right. Any number can be taken away from 3, so the domain is all of \({\R}\). Every number \({y}\) is an output, from the input \({3 - y}\), because \({h(3 - y) = 3 - (3 - y)} = {y}\). So the range is all of \({\R}\) too.
2. ★★ Which of these give \({y}\) as a function of \({x}\)? Explain each. (a) the pairs \({(1, 4)}\), \({(2, 4)}\), \({(3, 7)}\); (b) the pairs \({(1, 4)}\), \({(1, 5)}\), \({(2, 6)}\); (c) the curve \({x = y^2}\); (d) the rule \({y = \abs{x}}\).
(a) A function. Each input appears once. Two inputs share the output 4, which is allowed.
(b) Not a function. The input 1 has two outputs, 4 and 5.
(c) Not a function. The vertical line \({x = 4}\) meets the curve at \({(4, 2)}\) and at \({(4, -2)}\), because \({2^2 = 4}\) and \({(-2)^2 = 4}\).
(d) A function. Each number has one distance from 0. Its graph is a V with its corner at the origin, and every vertical line meets the V once.
3. ★★★ Find the domain and the range of \({k(x) = \sqrt{x - 1}}\), and sketch its graph from a short table.
Domain. The square root needs a number that is 0 or more, so \({x - 1 \geq 0}\), which means \({x \geq 1}\).
Table. \({k(1) = \sqrt{0} = 0}\), \({k(2) = \sqrt{1} = 1}\), \({k(5) = \sqrt{4} = 2}\) and \({k(10) = \sqrt{9} = 3}\). The graph starts at \({(1, 0)}\) and rises ever more slowly.
Range. A square root is never negative, so no output is below 0. Every \({y \geq 0}\) is reached: the input \({y^2 + 1}\) gives
\[ \begin{aligned} k(y^2 + 1) &= \sqrt{y^2 + 1 - 1} \\ &= \sqrt{y^2} = y , \end{aligned} \]
where the last step uses \({y \geq 0}\). So the range is all \({y \geq 0}\).
A function is a machine: each allowed input gives exactly one output.
Input, rule, output.
Sources. Each was opened and checked against this lesson on 12 November 2026.
def.numpy.linspace, version 2.5: evenly spaced numbers over an interval, the end included by default.Next. M01.3.2 Straight lines: slope and intercept studies the machines whose graphs are straight lines, and the two numbers that fix each one.
This lesson unlocks
M01.3.2 Straight lines: slope and intercept